
The completeness of the fossil record of plesiosaurs, marine reptiles from the Mesozoic
SAMUEL L. TUTIN and RICHARD J. BUTLER
Tutin, S.L. and Butler, R.J. 2017. The completeness of the fossil record of plesiosaurs, marine reptiles from the Mesozoic. Acta Palaeontologica Polonica 62 (3): 563–573.
Plesiosaurs were a highly successful group of marine reptiles occurring worldwide in the Jurassic and Cretaceous, but to date few studies have focused on their preservation through time. Here, we conduct the first detailed assessment of the quality of the plesiosaur fossil record. Data was compiled for 178 specimens representing 114 valid species. For each species we calculated the character completeness metric (CCM: percentage of phylogenetic characters from a cladistic dataset that can be scored for that species) and the skeletal completeness metric (SCM: percentage of the overall skeleton that is preserved for that species). Average CCM and SCM values were calculated for individual geological stages. A strong significant positive correlation was recovered between CCM and SCM, suggesting that the two metrics are recording the same signal, at least for this clade. Although a significant correlation between changes in sea level and changes in plesiosaur completeness was not recovered, an underlying negative relationship may be present but obscured by poorly sampled time bins. Plesiosaur completeness though time is not significantly correlated with that for contemporary terrestrial groups (sauropods, pterosaurs, birds), but is significantly correlated with that for ichthyosaurs, suggesting common controls on skeletal preservation in the marine realm. Significantly higher median completeness values in plesiosaurs and ichthyosaurs than in contemporary terrestrial groups support the hypothesis that the marine tetrapod fossil record is more complete than that of terrestrial tetrapods. A collector’s curve for plesiosaurs shows a generally slow constant rate of discovery from the latter part of the 19th century until the 1990s, at which point the rate of discovery increased substantially and shows no sign of slowing. A significant but very weak negative correlation between SCM and the year in which a taxon was named suggests a weak tendency for more recently named species to have less complete skeletons.
Key words: Plesiosauria, Ichthyosauria, diversity, macroevolution, sea level, Jurassic, Cretaceous.
Samuel Tutin [samtutin@icloud.com] and Richard J. Butler [r.butler.1@bham.ac.uk] (corresponding author), School of Geography, Earth and Environmental Sciences, University of Birmingham, Edgbaston, Birmingham, B15 2TT, UK.
Received 13 February 2017, accepted 27 April 2017, available online 16 August 2017.
Copyright © 2017 S. Tutin and R.J. Butler. This is an open-access article distributed under the terms of the Creative Commons Attribution License (for details please see http://creativecommons.org/licenses/by/4.0/), which permits unrestricted use, distribution, and reproduction in any medium, provided the original author and source are credited.
Introduction
Plesiosaurs (Sauropterygia, Plesiosauria) are a clade of large-bodied, carnivorous, secondarily aquatic reptiles that were important components of marine ecosystems worldwide during the Jurassic and Cretaceous, and which are known from abundant fossil remains (Ketchum and Benson 2010). The fossil record and biology of plesiosaurs have been the focus of considerable study since the discovery of the first plesiosaur genus, Plesiosaurus, in 1822 by Conybeare (Conybeare 1822). The last two decades have seen a surge in the study of plesiosaurs, including the redescription and taxonomic revision of key historical specimens and species (e.g., Großmann 2007; Smith and Dyke 2008; Benson et al. 2011, 2012; Kear and Barrett 2011; Vincent 2011, 2012; Vincent and Benson 2012; Brown et al. 2013; Smith 2015), discoveries of new species (e.g., Druckenmiller 2002; O’Keefe 2004; Kear et al. 2006; Druckenmiller and Russell 2008; Benson et al. 2012, 2013; Otero et al. 2014; O’Gorman et al. 2015), and cladistic analyses of plesiosaur phylogeny (O’Keefe 2001; Druckenmiller and Russell 2008; Smith and Dyke 2008; Ketchum and Benson 2010; Benson et al. 2012).
To date, the nature and quality of the plesiosaur fossil record has not received extensive study, although plesiosaurs were previously included in global analyses of Mesozoic marine reptile diversity and fossil record sampling (Benson et al. 2010; Benson and Butler 2011). Quantification of variation in the plesiosaur fossil record has the potential to yield novel insights into ongoing discussion of the causes of variation through time in vertebrate specimen quality, as well its impact on our ability to extract genuine diversity signals from the fossil record (e.g., Mannion and Upchurch 2010; Brocklehurst et al. 2012; Walter and Fröbisch 2013; Brocklehurst and Fröbisch 2014; Cleary et al. 2015; Dean et al. 2016; Verrière et al. 2016). Moreover, fossil record completeness for contemporary marine (ichthyosaur; Cleary et al. 2015) and terrestrial (e.g., Mannion and Upchurch 2010) groups have been examined recently, indicating the potential to examine shared fossil record signals in the marine realm, and to draw comparisons between marine and terrestrial fossil records.
Here, we quantify the fossil record of plesiosaurs in detail for the first time, using recently developed metrics (Mannion and Upchurch 2010) to examine changes in the completeness of plesiosaur fossil specimens across their evolutionary history, and compare these changes with temporal variation in species richness, sea level, fossil record sampling, and the fossil records of other contemporary clades from both marine and terrestrial realms.
Abbreviations.—CCM, character completeness metric; FDR, false discovery rate; FMF, fossiliferous marine formations, MTBC, marine tetrapod-bearing collections; SCM, skeletal completeness metric.
Methods
Dataset.—A list of all valid plesiosaur taxa was compiled from the published literature and from data in the Paleobiology Database (data downloaded 1st August 2016). This list was scrutinised for nomen dubia (which were excluded) and synonyms. The final dataset (see SOM available at http://app.pan.pl/SOM/app62-Tutin_Butler_SOM.pdf) consists of the museum accession number, references, temporal range, locality, stratigraphic horizon, and completeness metrics for 114 valid taxa represented by 178 different specimens. The dataset is complete as of 1st October 2016.
Completeness metrics.—Mannion and Upchurch (2010) proposed two metrics to quantify the completeness of a fossil vertebrate skeleton, and these metrics have been used to assess fossil record completeness in a number of different Palaeozoic and Mesozoic groups including sauropodomorph dinosaurs, Mesozoic birds, anomodonts, basal synapsids, ichthyosaurs, pterosaurs and parareptiles (Mannion and Upchurch 2010; Brocklehurst et al. 2012; Walter and Fröbisch 2013; Brocklehurst and Fröbisch 2014; Cleary et al. 2015; Dean et al. 2016; Verrière et al. 2016). The character completeness metric (CCM) quantifies the potential phylogenetic data preserved in specimens; a percentage score is provided for the number of phylogenetic characters from a given cladistic dataset that can be coded (or could theoretically be coded) for a specimen or taxon. Two variants of the metric were proposed by Mannion and Upchurch (2010): CCM1 estimates the completeness of the most complete specimen of a given species, whereas CCM2 estimates completeness based on all specimens referred to that species. CCM2 has generally been preferred over CCM1 (e.g., Brocklehurst et al. 2012; Dean et al. 2016). The skeletal completeness metric (SCM) attempts to quantify the percentage of the overall skeleton that is preserved for a specimen or taxon; as for CCM, there are two variants, with SCM1 quantifying percentage completeness for the most complete skeleton, and SCM2 quantifying percentage completeness across all referred specimens. In this study, we calculated both CCM and SCM for plesiosaurs, including both variants of each metric.
To estimate CCM1 and CCM2 we used the phylogenetic data matrix of Benson and Druckenmiller (2014). This dataset includes 75 plesiosaurian and 5 Triassic sauropterygian species and 270 different characters. As used here, the CCM score is the percentage of phylogenetic characters that could in theory be scored (the scoring was not actually conducted) for that specimen based on the skeletal elements preserved. For example, if a maxilla was present in the specimen, then all maxillary characters were considered as scorable.
To estimate SCM scores, we first divided the plesiosaur body shape up into regions, each of which was assigned different estimated percentages based on its relative size and volume. The regions and estimated percentages used in other fossil record completeness studies were used as a general guideline and starting point (Mannion and Upchurch 2010; Cleary et al. 2015). The regions selected were as follows: skull and mandible, cervical vertebrae and ribs, dorsal and sacral vertebrae and ribs, caudal vertebrae, pectoral girdle, forelimbs, pelvic girdle, forelimbs, hindlimbs, and others (i.e., parts of the skeleton such as the gastralia that do not fall into the other regions). Figure 1 shows the skeletal regions and Table 1 shows their estimated percentage for each of three different plesiosaur morphotypes used here. Individual elements in different regions are also given an estimated percentage based on their relative sizes. For example, a complete femur is scored at 2.5% whereas a complete tibia is scored as 1%. The number of cervical vertebrae in different plesiosaur species differs greatly from one another, and therefore so does overall neck length (O’Keefe 2002). This complicates estimation of cervical region completeness in taxa with incomplete necks. Mannion and Upchurch (2010) presented a method to calculate the percentage completeness of vertebral regions, as a similar issue of high variability in vertebral counts also exists for sauropodomorphs. First, the total number of vertebrae expected in a region is estimated based on comparisons with closely related taxa. The estimated total percentage for a vertebral region is then divided by the estimated total number of vertebrae expected, and then multiplied by the actual number of vertebrae preserved.
We did not consider every single specimen ever assigned to a taxon; instead, up to five specimens from each species were scored for completeness (mean = 1.57), with the most complete or historically most significant specimens (e.g., holotypes) scored first. Information was drawn primarily from published descriptions and illustrations.
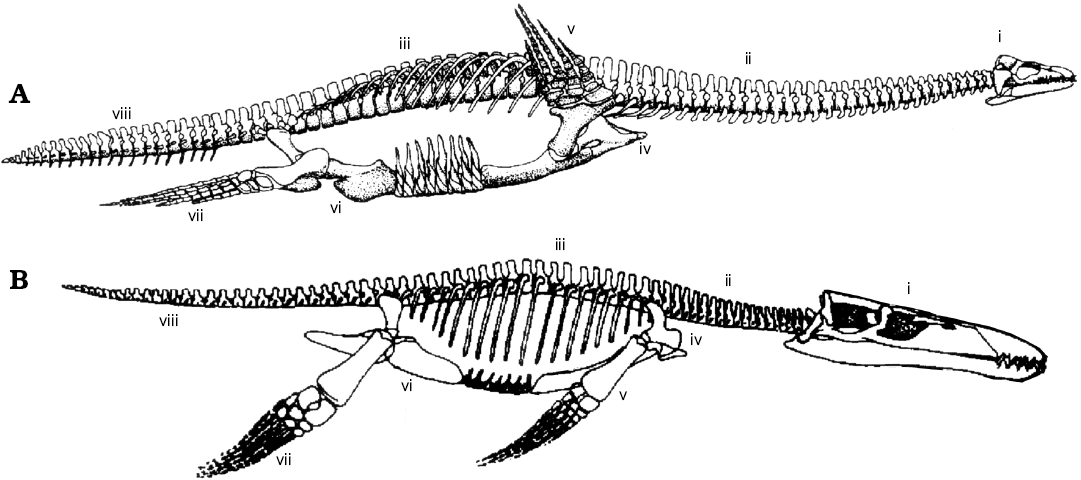
Fig. 1. Two of the three different morphotypes used in Plesiosauria in this analysis, demonstrating the different regions used in skeletal completeness metrics. A. Cryptoclidus, a “plesiosauromorph”. B. Liopleurodon, a “pliosauromorph”. Skeletal regions: i, skull and mandible; ii, cervical vertebrae and ribs; iii, dorsal and sacral vertebrae and ribs; iv, pectoral girdle; v, fore limbs; vi, pelvic girdle; vii, hind limbs; viii, caudal vertebrae and ribs. Outlines modified from O’Keefe (2002). Not to scale.
Table 1. Percentages assigned to different skeletal regions for the three plesiosaur morphotypes used here, as well as the percentage of phylogenetic characters for each region within the character list of Benson and Druckenmiller (2014).
|
Skeletal region |
Characters |
“Pliosauromorph” |
“Plesiosauromorph” |
“Elasmosauromorph” |
|
Skull and mandible |
51.9 |
17 |
8 |
6 |
|
Cervical vertebrae |
13.3 |
7 |
15 |
24 |
|
Dorsal and sacral vertebrae |
3.3 |
14 |
14 |
13.5 |
|
Caudal vertebrae |
3.3 |
10 |
10 |
8.5 |
|
Pectoral girdle |
9.3 |
10 |
11 |
10 |
|
Forelimbs |
6.7 |
13 |
13 |
12 |
|
Pelvic girdle |
4.4 |
11 |
11 |
10.5 |
|
Hindlimbs |
6.7 |
13 |
13 |
12 |
|
Other |
1.1 |
5 |
5 |
3.5 |
Time bins.—Stage-level time bins were chosen in order to facilitate comparisons with completeness scores generated for other groups of Mesozoic tetrapods (Mannion and Upchurch 2010; Cleary et al. 2015; Dean et al. 2016) and comparative time series such as sea level (see below). A mean average value for CCM1, CCM2, SCM1, and SCM2 was therefore estimated for each stage of the Jurassic and Cretaceous.
Bathonian and Coniacian.—No valid plesiosaur taxa are included in the dataset from the Bathonian stage of the Middle Jurassic and the Coniacian stage of the Late Cretaceous. Although these time intervals might represent periods of genuinely low diversity, plesiosaurs were clearly not completely absent because in each case the clade is present in stratigraphically younger intervals. The inclusion of bins with completeness scores of zero has the potential to adversely influence the strength and significance of correlation analyses. As a result, we excluded the Bathonian and Coniacian when conducting statistical comparisons. Similar problems existed with comparative time series (see below), i.e., zero values for pterosaurs for the Aalenian, and ichthyosaurs for the Bathonian and Valanginian. Comparisons made with these time series therefore also excluded bins with zero values.
Comparative time series.—Plesiosaur species richness was compiled for each stage of the Jurassic and Cretaceous. Jurassic and Cretaceous sea level data was sourced from Butler et al. (2011), based on Haq et al. (1987) and Miller et al. (2005). Two different estimates of fossil record sampling were used. Counts of fossiliferous marine formations (FMFs) were taken from Benson et al. (2010), originally sourced from the Paleobiology Database, and used as a proxy for temporal variation in research effort, facies diversity and the volume of fossil-bearing marine rock available for sampling. FMFs represent formations in which plesiosaur specimens and remains could theoretically be sampled. Marine tetrapod-bearing collections (MTBCs) were derived from Dean et al. (2016), also originally sourced from the Paleobiology Database, and represent an estimate of the number of geographic localities from which marine tetrapod fossils have been collected. FMFs and MTBCs were used instead of counts of numbers of formations yielding plesiosaurs, in order to provide a more global estimate of sampling, reducing the possibility of “redundancy” (Benton et al. 2011).
Plesiosaur completeness metrics were also compared with those for other Mesozoic tetrapod groups for which completeness data has been compiled. The only other group of marine reptiles for which completeness data are available are ichthyosaurs, and SCM2 data for plesiosaurs was compared to data for ichthyosaurs from Cleary et al. (2015) in order to test for common patterns in preservation of marine tetrapods through the Mesozoic. Comparisons to three terrestrial groups were made to test whether skeletal completeness for marine taxa is better than for terrestrial taxa, and to identify any shared patterns through time. Completeness data were taken from Brocklehurst et al. (2012) for birds (CCM2), Dean et al. (2016) for pterosaurs (CCM2) and Mannion and Upchurch (2010) for sauropodomorphs (CCM2, SCM2). Mannion and Upchurch (2010) presented their sauropodomorph data in substage time bins, but this was recalculated into stage-level time bins by Dean et al. (2016).
We did not distinguish Lagerstätten from other deposits for statistical comparisons, unlike in some previous studies such as that on pterosaurs (e.g., Dean et al. 2016), due to the difficulties involved in defining Lagerstätten in a non-arbitrary manner.
Unlike some previous analyses of completeness (e.g., Brocklehurst et al. 2012), we do not attempt to make comparisons between completeness metrics and estimates of species richness that attempt to account for variable spatiotemporal sampling of the fossil record. This is because the plesiosaur record is not sufficiently well sampled and has too many singleton taxa (species or genera known from just a single locality) to allow the most rigorous and appropriate diversity estimators (e.g., shareholder quorum subsampling; Alroy 2010) to be used.
Statistical tests.—Non-temporal pairwise comparisons of populations of completeness values for plesiosaurs and other Mesozoic tetrapod groups were made using non-parametric Mann-Whitney-Wilcoxon tests, which assess differences in the population medians and distribution.
Correlation tests were used to compare changes in plesiosaur completeness metrics through time to one another, as well as to temporal variation in species richness, time bin length, sea level, FMFs, and MTBCs, and the completeness of ichthyosaurs, birds, sauropodomorphs and pterosaurs. All time series were log-transformed prior to analysis, and data series were further transformed using generalised differencing to remove the effects of trend and temporal autocorrelation. We also tested the correlation between species completeness and the year in which that species was named. Pearson’s product-moment correlation coefficients were calculated for each pairwise comparison, and false discovery rate (FDR; Benjamini and Hochberg 1995) corrections were used to correct for multiple comparisons.
All statistical analyses were conducted in R, and generalised differencing utilised a function written by Graeme Lloyd. Time series plots were produced using the package strap (Bell and Lloyd 2015).
Results
Changes in completeness through time.—CCM1 and CCM2 are very strongly correlated with one another (r2 = 0.99, adjusted p = 2.18E-21), as is also the case for comparisons between SCM1 and SCM2 (r2 = 0.99, adjusted p = 2.63E-19) (Table 2). As such, our description of temporal patterns in completeness does not distinguish between these different variants of CCM and SCM, and statistical comparisons focus on CCM2 and SCM2. CCM2 and SCM2 are also very strongly correlated (r2 = 0.90, adjusted p = 1.62E-09), indicating that these alternative skeletal completeness metrics are recording an essentially identical signal.
Initial completeness in the Hettangian (Fig. 2A) is relatively high for both CCM and SCM scores (~60%), and high completeness scores (~52–55% for CCM, 52–70% for SCM) are maintained throughout the Lower Jurassic. These high completeness values early in plesiosaur evolution result from well-sampled rock sequences such as the Lias Group of the UK, which has yielded many excellent, near complete specimens of plesiosaurs (e.g., Thalassiodracon hawkinsi, which has a complete SCM2 score), and the Posidonia Shale of Holzmaden, southwest Germany (e.g., Plesiopterys wildi, with completeness scores of 70.4% for CCM and 85.7% for SCM; O’Keefe 2004).
Completeness values through most of the Middle Jurassic (Aalenian–Bathonian) are substantially lower than those of the Lower Jurassic, reflecting the existence of only a small number of localities that produce sparse assemblages of very incomplete specimens. CCM and SCM scores for the Aalenian are extremely low (~4% for CCM, ~5% for SCM), as the few fossils that represent this stage are extremely incomplete. Completeness is moderately higher in the Bajocian (~22% for CCM, ~18% for SCM). No valid taxa or specimens were included for the Bathonian, meaning that all completeness scores for this stage were zero. Completeness recovers in the Callovian to reach similar values to those of the Lower Jurassic (~63% for both CCM and SCM). This high completeness reflects discoveries from the Peterborough Member of the Oxford Clay Formation, a site of excellent fossil preservation.
Upper Jurassic completeness values are relatively low with only minor fluctuations (ranging from ~23–27% for CCM and 23–31% for SCM). Completeness values rise across the Jurassic–Cretaceous boundary, reaching ~55% for CCM and ~59% for SCM in the Berriasian, although only two specimens (representing two species) are known for this stage. Completeness then declines to lower levels in the Valanginian–Barremian (ranging from ~37–46% for CCM and 22–48% for SCM), although these stages remain poorly sampled. CCM and SCM diverge from one another more strongly in the Cretaceous than in the Jurassic data, with SCM tending to be lower than CCM, and this may reflect the emergence of the “elasmosauromorph” body plan and the difference in the weighting given to the skull in CCM and SCM metrics for species possessing this body plan. This interpretation is supported by the correlation between CCM and SCM being strongest for pliosauromorph taxa (r2 = 0.76, p = 2.2E-16; n = 51), intermediate but very strong for plesiosauromorphs (r2 = 0.55, p = 1.59E-09; n = 49) and weakest for elasmosauromorphs (r2 = 0.29, p = 0.04; n = 14), although the latter are represented by the smallest sample size. No significant differences are recognised between the overall distributions of CCM and SCM values for different morphotypes when FDR comparisons are used (Table 3).
Completeness values are generally high from the Aptian through until the end of the Cretaceous. CCM is relatively static, with most stages having values of ~55–68%. SCM is also fairly consistent, ranging from ~40–55%. The last two of stages of the Cretaceous (Campanian–Maastrichtian) are relatively well sampled, and show consistent high completeness values.
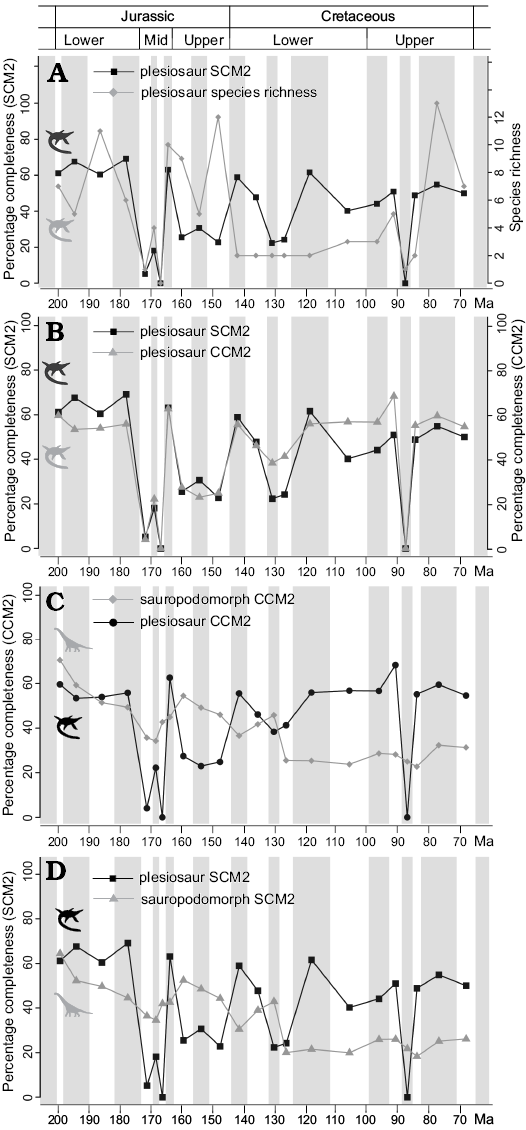
Fig. 2. Changes in skeletal completeness through time. A. Plesiosaur SCM2 and plesiosaur species richness. B. Plesiosaur CCM2 and SCM2. C. Plesiosaur CCM2 and sauropodomorph CCM2. D. Plesiosaur SCM2 and sauropodomorph SCM2. Silhouettes are from phylopic.org, and are credited to Adam Stuart Smith (Plesiosaurus) and Scott Hartman (Brachiosaurus). Abbreviations: CCM, character completeness metric; SCM, skeletal completeness metric (for detailed explanation of terms see Completeness metrics in Methods section).
Time series comparisons.—Plesiosaur completeness is significantly, or marginally non-significantly, correlated with FMFs and species richness, but these correlations are non-significant following FDR corrections (Table 2), and scatterplots suggest that they largely result from a single influential outlier (Fig. 3A, B; see Discussion). No significant correlation is recovered between plesiosaur completeness and MTBCs, sea level change, or time bin length, and plesiosaur completeness is also not significantly correlated with temporal variation in the completeness of sauropodomorphs, Mesozoic birds, or pterosaurs (Figs. 2, 4; Table 2). However, SCM values for plesiosaurs do show significant correlations with those for ichthyosaurs (r2 = 0.43, adjusted p = 0.034), and this relationship is evident in a scatterplot of generalised differenced values for plesiosaurs and ichthyosaurs (Fig. 3C). Plesiosaur and ichthyosaur time series for SCM show clear similarities, including high values in the Lower Jurassic, low values through the Aalenian–Bathonian, high values in the Callovian followed by moderate Upper Jurassic values, and then similar fluctuations in completeness through the Lower Cretaceous.
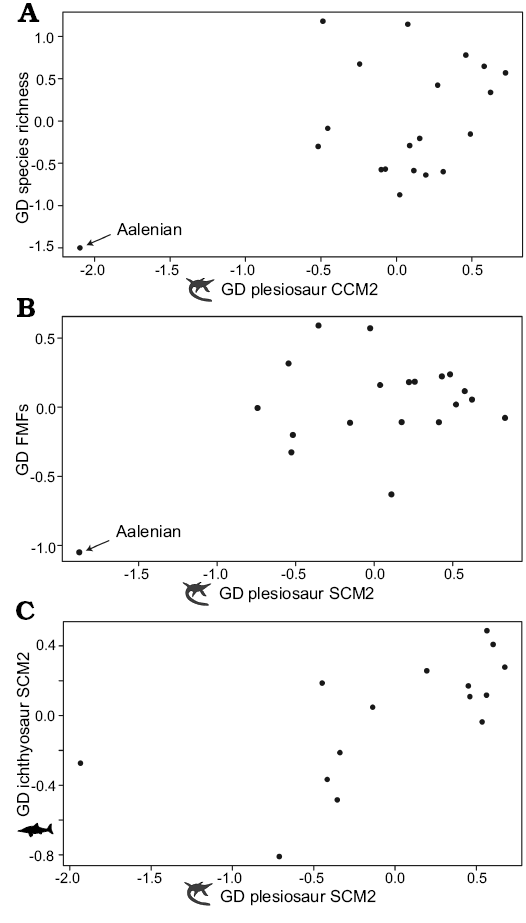
Fig. 3. Scatterplots comparing generalised differenced (GD) plesiosaur CCM2 and SCM2 to GD data for other time series. A. Plesiosaur CCM2 versus species richness. A weak but significant correlation between the two is driven largely by an influential data point, the Aalenian. B. Plesiosaur SCM2 versus fossiliferous marine formations (FMFs). A weak but significant correlation between the two is driven largely by an influential data point, the Aalenian. The scatterplot for CCM2 versus FMFs (not shown) shows a largely identical pattern. C. Plesiosaur SCM2 versus ichthyosaur SCM2. Silhouettes are from phylopic.org, and are credited to Adam Stuart Smith (Plesiosaurus) and Gareth Monger (Ichthyosaurus). Abbreviations: CCM, character completeness metric; FMF, fossiliferous marine formations; GD, generalised differenced; SCM, skeletal completeness metric (for detailed explanation of terms see Completeness metrics in Methods section).
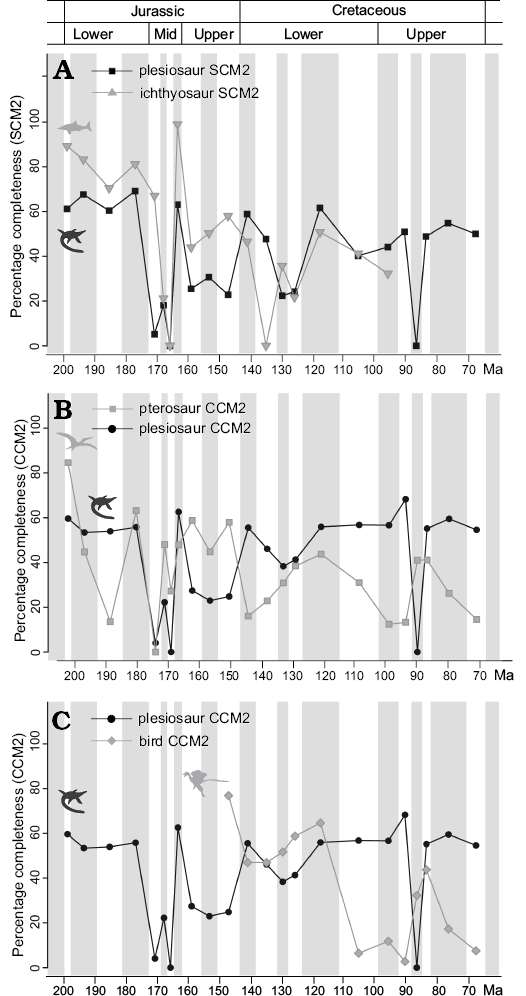
Fig. 4. Changes in skeletal completeness through time. A. Plesiosaur SCM2 and ichthyosaur SCM2. B. Plesiosaur CCM2 and pterosaur CCM2. C. Plesiosaur CCM2 and Mesozoic bird CCM2. Silhouettes are from phylopic.org, and are credited to Adam Stuart Smith (Plesiosaurus), T. Michael Keesey (Archaeopteryx), and Gareth Monger (Pterodactylus, Ichthyosaurus). Abbreviations: CCM, character completeness metric; SCM, skeletal completeness metric (for detailed explanation of terms see Completeness metrics in Methods section).
Table 2. Results of pairwise comparisons between time series using Pearson’s product-moment correlation coefficients. All time series were log-transformed and subjected to generalised differencing prior to comparisons being made. Asterisks indicate statistically significant results. Abbreviations: CCM, character completeness metric; FDR, false discovery rate; SCM, skeletal completeness metric (for detailed explanation of terms see Completeness metrics in Methods section).
|
Dataset 1 |
Dataset 2 |
R |
p-value |
p-values following FDR corrections |
|
plesiosaur CCM1 |
plesiosaur CCM2 |
0.998 |
1.21E-22* |
2.18E-21* |
|
plesiosaur SCM1 |
plesiosaur SCM2 |
0.996 |
2.92E-20* |
2.63E-19* |
|
plesiosaur CCM2 |
plesiosaur SCM2 |
0.947 |
2.70E-10* |
1.62E-09* |
|
plesiosaur SCM2 |
bin length |
0.267 |
0.255 |
0.328 |
|
plesiosaur CCM2 |
bin length |
0.238 |
0.313 |
0.375 |
|
plesiosaur CCM2 |
sea level |
-0.334 |
0.150 |
0.246 |
|
plesiosaur SCM2 |
sea level |
-0.299 |
0.201 |
0.301 |
|
plesiosaur CCM2 |
FMFs |
0.517 |
0.019* |
0.070 |
|
plesiosaur SCM2 |
FMFs |
0.466 |
0.038* |
0.115 |
|
plesiosaur CCM2 |
MTBCs |
0.372 |
0.106 |
0.191 |
|
plesiosaur SCM2 |
MTBCs |
0.441 |
0.052 |
0.117 |
|
plesiosaur CCM2 |
species richness |
0.446 |
0.049* |
0.117 |
|
plesiosaur SCM2 |
species richness |
0.422 |
0.064 |
0.127 |
|
plesiosaur CCM2 |
sauropodomorph CCM2 |
0.202 |
0.393 |
0.442 |
|
plesiosaur SCM2 |
sauropodomorph SCM2 |
0.047 |
0.845 |
0.845 |
|
plesiosaur SCM2 |
ichthyosaur SCM2 |
0.659 |
0.007* |
0.034* |
|
plesiosaur CCM2 |
bird CCM2 |
-0.399 |
0.224 |
0.310 |
|
plesiosaur CCM2 |
pterosaur CCM2 |
-0.143 |
0.547 |
0.579 |
Comparisons with other clades.—Mann-Whitney-Wilcoxon test results (Table 3; Fig. 5) indicate that median completeness values for plesiosaurs are significantly higher than those for sauropodomorphs (adjusted p = 0.001), birds (adjusted p = 0.0001), and pterosaurs (adjusted p = 0.003). SCM values for ichthyosaurs are significantly higher than those for plesiosaurs (adjusted p = 0.01).
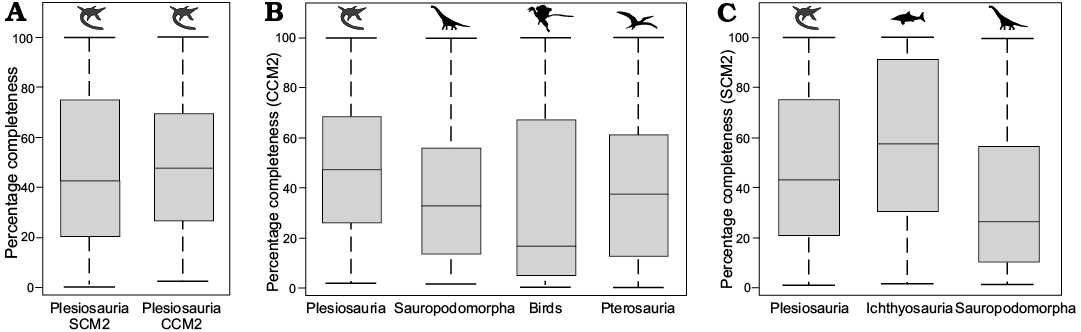
Fig. 5. Box-and-whisker plots showing the distribution of CCM2 and SCM2 data for several major clades of Mesozoic tetrapods. A. Comparison of SCM2 and CCM2 data for plesiosaurs. B. Comparison of CCM2 data for plesiosaurs, sauropodomorphs (from Mannion and Upchurch 2010), birds (from Brocklehurst et al. 2012), and pterosaurs (from Dean et al. 2016). C. Comparison of SCM2 data for plesiosaurs, ichthyosaurs (from Cleary et al. 2015), and sauropodomorphs (from Mannion and Upchurch 2010). All silhouettes are from phylopic.org, and are credited to Adam Stuart Smith (Plesiosaurus), Scott Hartman (Brachiosaurus), T. Michael Keesey (Archaeopteryx), and Gareth Monger (Pterodactylus, Ichthyosaurus). Abbreviations: CCM, character completeness metric; SCM, skeletal completeness metric (for detailed explanation of terms see Completeness metrics in Methods section).
Table 3. Results of comparisons of the population median and distribution of completeness values for different Mesozoic vertebrate clades and plesiosaur morphotypes using Mann-Whitney-Wilcoxon tests. Asterisks indicate statistically significant results. See Fig. 5 for boxplot comparisons of clade comparisons. Abbreviations: CCM, character completeness metric; FDR, false discovery rate; SCM, skeletal completeness metric.
|
Dataset 1 |
Dataset 2 |
Test statistic (W) |
p-value |
p-values following FDR corrections |
|
plesiosaur SCM |
plesiosaur CCM |
6242 |
0.61 |
0.61 |
|
plesiosaur SCM |
ichthyosaur SCM |
4636 |
0.01* |
0.01* |
|
plesiosaur SCM |
sauropodomorph SCM |
12363 |
0.0004* |
0.001* |
|
plesiosaur CCM |
sauropodomorph CCM |
12313 |
0.0005* |
0.001* |
|
plesiosaur CCM |
Mesozoic bird CCM |
9609 |
0.00002* |
0.0001* |
|
plesiosaur CCM |
pterosaur CCM |
11893 |
0.002* |
0.003* |
|
“plesiosauromorph” SCM |
“pliosauromorph” SCM |
1545 |
0.042* |
0.123 |
|
“plesiosauromorph” SCM |
“elasmosauromorph” SCM |
393 |
0.413 |
0.413 |
|
“pliosauromorph” SCM |
“elasmosauromorph” SCM |
299.5 |
0.363 |
0.413 |
|
“plesiosauromorph” CCM |
“pliosauromorph” CCM |
1182.5 |
0.647 |
0.647 |
|
“plesiosauromorph” CCM |
“elasmosauromorph” CCM |
269 |
0.224 |
0.532 |
|
“pliosauromorph” CCM |
“elasmosauromorph” CCM |
298.5 |
0.355 |
0.532 |
Historical measures of completeness.—There is no significant correlation between the year in which a plesiosaur species was named and CCM for that species (r2 = 0.02, p = 0.13; Fig. 6A). A significant negative correlation was recovered between the year a plesiosaur species was named and the SCM for that species (r2 = 0.08, p = 0.002), suggesting that more recently named species tend to be less completely preserved (Fig. 6B), but the very low r2 value indicates that this relationship is weak and explains little of the observed variation. A collector’s curve (Fig. 6C) indicates a generally slow but steady increase in the number of named species from around 1870–1990, with a marked inflection and an increase in the rate of species diversity from the 1990s onwards.
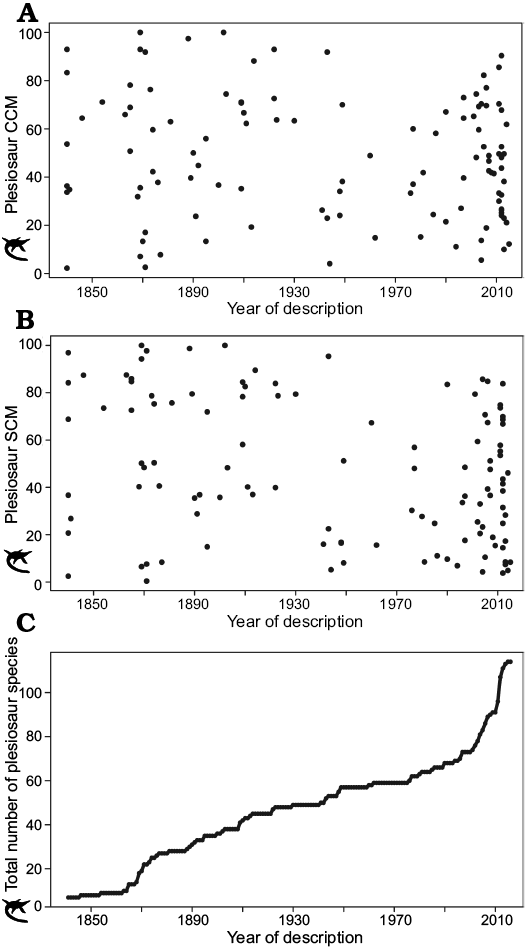
Fig. 6. Plesiosaur completeness and discovery through historical time. A. Plesiosaur CCM compared to the year in which the species was named. B. Plesiosaur SCM compared to the year in which the species was named. C. Collector’s curve of the accumulation of valid plesiosaur species through time. Abbreviations: CCM, character completeness metric; SCM, skeletal completeness metric.
Discussion
Correlation between CCM and SCM.—As recovered by Mannion and Upchurch (2010), we found very strong positive correlations between CCM1 and CCM2 and between SCM1 and SCM2. The strength of these correlations supports the suggestion that these different formulations of the same metrics essentially convey the same information (Mannion and Upchurch 2010). For this reason, most subsequent studies using these metrics have chosen only to calculate CCM2 or SCM2, or both (e.g., Brocklehurst and Fröbisch 2014; Dean et al. 2016), and have excluded CCM1 and SCM1. We also recovered a strong positive correlation between CCM2 and SCM2, as in previous comparisons (Mannion and Upchurch 2010; Brocklehurst and Fröbisch 2014; Verrière et al. 2016). A weaker correlation between the two might perhaps have been predicted based on the different percentages allocated to the same skeletal regions (Table 1), especially for the skull (which is weighted much more heavily by the CCM). Although it has been suggested that CCM and SCM quantify different aspects of fossil preservation (Mannion and Upchurch 2010), the fact that they are both recording essentially the same signal suggests that calculating only one of the metrics might be sufficient to quantify temporal variation in the fossil record in future completeness studies.
With the methods implemented here, calculation of CCM is more rigorous and repeatable than that of SCM. This is because the percentages assigned to different skeletal regions in our calculation of SCM do not represent precise estimations, and this is similar to the calculation of SCM in some previous studies (e.g., Mannion and Upchurch 2010; Cleary et al. 2015). Moreover, considerable disparity between body proportions occurs in different taxa. Although we identified three distinct morphotypes among plesiosaurs and assigned skeletal percentages differently to each of these morphotypes, this represents only a partial solution. Alternative approaches would involve dividing plesiosaurs up into a greater number of morphotypes, or more precisely calculating the percentage of overall skeletal volume represented by individual elements (e.g., Verrière et al. 2016). However, these alternative approaches would be exceptionally time consuming; the strong correlation recovered here between CCM and SCM suggests that our implementation of SCM does capture an accurate signal of completeness change through time and that more detailed refinements of the SCM approach may not be worth the extra time investment.
Comparisons with sea level and sampling time series.—Previous work on ichthyosaurs recovered a significant negative correlation between sea level and ichthyosaur completeness, suggesting that ichthyosaur specimen completeness is highest during times of low sea level and deteriorates as sea levels rise (Cleary et al. 2015). Our statistical comparisons also recovered negative correlation coefficient values for comparisons of sea level and plesiosaur completeness (Table 2), but the correlations were not significant. However, visual comparisons of scatterplots for generalised differenced plesiosaur completeness data are suggestive of a negative relationship between plesiosaur completeness and sea level (Fig. 7). For CCM2, a significant negative correlation (r = -0.52, r2 = 0.27, p = 0.02) is recovered when the data point for the Aalenian is excluded, whereas exclusion of the Aalenian and Valanginian results in a significant negative correlation between SCM2 and sea level (r = -0.62, r2 = 0.38, p = 0.007). The Aalenian has exceptionally low completeness values (see above), and forms an outlier that biases statistical results. The Valanginian has moderate completeness values (CCM2 = 46%, SCM2 = 48%) but notably low sea level values compared to the majority of the remainder of the Cretaceous. Both of these time bins are poorly sampled, with only one species included for the Aalenian, and two for the Valanginian. As for ichthyosaurs (Cleary et al. 2015), there may therefore be an underlying negative correlation between plesiosaur specimen completeness and sea level, although this interpretation should be treated with caution given that it is only recovered after data points are (somewhat arbitrarily) excluded. Moreover, the causal mechanism of this relationship remains unclear and is worthy of further examination.
Our comparisons between plesiosaur completeness and sampling recovered significant positive correlations with FMFs, although this correlation was rendered non-significant by FDR corrections. Scatterplots show that these correlations are driven entirely by the Aalenian (Fig. 3B), which has extreme low values for both completeness and FMFs, and these correlations disappear when the Aalenian is excluded (e.g., comparison of SCM2 and FMFs when Aalenian excluded: r = 0.007, p = 0.98). As such, plesiosaur completeness and estimates of fossil record sampling do not appear to be correlated with one another. The same is true of the marginally significant to marginally non-significant correlations between plesiosaur completeness and plesiosaur species richness (Fig. 3A), which appear to result from the exceptionally low species richness and completeness present in the Aalenian. The lack of robust correlation between species richness and skeletal completeness suggests that the latter does not represent a major sampling bias controlling our understanding of plesiosaur diversity through time.
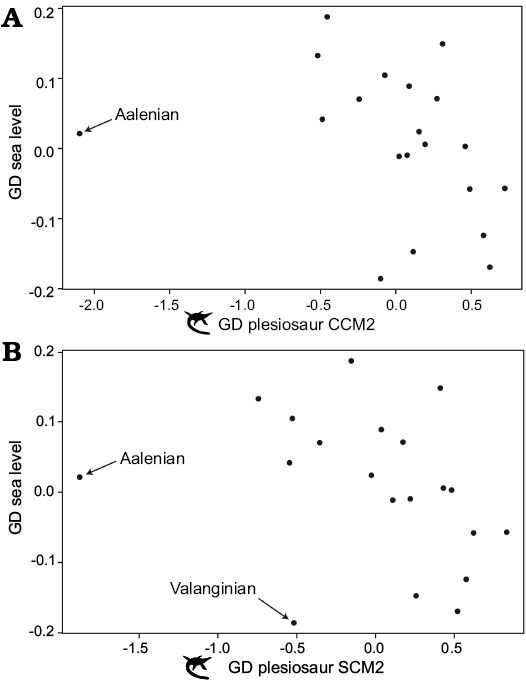
Fig. 7. Scatterplots comparing generalised differenced (GD) plesiosaur completeness data to GD sea level data. A. GD CCM2 versus GD sea level. Note the apparent existence of a correlation that is obscured by one outlier (Aalenian). B. GD SCM2 versus GD sea level. Note the apparent existence of a correlation that is obscured by two outliers (Aalenian, Valanginian). Abbreviations: CCM, character completeness metric; SCM, skeletal completeness metric (for detailed explanation of terms see Completeness metrics in Material nd methods section).
Comparisons with other taxonomic groups.—Time series comparisons show no significant correlations between the completeness of plesiosaurs and those of pterosaurs, birds or sauropodomorphs. However, there is a strong positive correlation between completeness values of ichthyosaurs and plesiosaurs through the Jurassic and the Cretaceous. This suggests that there are common controls on skeletal preservation in the marine realm that affected the different body plans and shapes of ichthyosaurs and plesiosaurs in a similar way. The absence of significant correlations with terrestrial groups supports the idea that different taphonomic processes act upon the vertebrate record in the marine and terrestrial environments (Behrensmeyer et al. 2000).
Ichthyosaurs and plesiosaurs coexisted throughout the Mesozoic seas up to the extinction of ichthyosaurs. They are commonly found in the same formations, and there is also evidence of direct interactions: for example, an embryonic specimen of an ichthyosaur (possibly Opthalmosaurus natans) was found within the abdomen of a specimen of the Oxfordian plesiosaur Pantosaurus striatus (O’Keefe et al. 2009). Because both of these groups were large, marine reptiles that coexisted in the same environments, similarities in their preservation are perhaps unsurprising. Dean et al. (2016) found a similar result in the terrestrial realm: pterosaur character completeness values correlated strongly with those for birds, which share a similar body plan and overlapped with them environmentally, but not with the larger, more robust and overall differently shaped sauropodomorphs.
Median skeletal completeness for the marine clades considered here (plesiosaurs, ichthyosaurs) was significantly higher than that of all the contemporaneous terrestrial groups. This provides quantitative support from skeletal completeness metrics that the terrestrial vertebrate record is less complete than that of marine vertebrates. However, it is worth noting that none of the three terrestrial clades for which comparative data was available are ideal comparisons to plesiosaurs and ichthyosaurs: birds and pterosaurs have unusual fossil records dominated by Lagerstätten due to their fragile skeletons, whereas the extreme large size of sauropods may impose its own biases. Future comparisons to other dinosaur clades (e.g., theropods, ornithischians) will be needed for more comprehensive comparisons of marine and terrestrial skeletal completeness.
Historical measures of completeness.—The collector’s curve shows how the research of plesiosaurs has changed since the earliest discoveries. During the first half of the 19th century, the rate of discovery was low. Many species that were named were based upon incomplete specimens, and these species are no longer considered valid. A notable increase in the rate of plesiosaur species discovery around 1870 can be linked to events such as the “Bone Wars” of Othniel Charles Marsh and Edward Drinker Cope, with the latter naming many species from the Cretaceous of the United States, such as Elasmosaurus platyurus and Polycotylus latipinnis (Cope 1869; Storrs 1984). The rate of plesiosaur discovery was slow and fairly constant through the latest part of the 19th century and much of the 20th century, until the 1990s when the rate of discovery substantially increased. Since 1990 around 2–3 new species have been being described on average each year. This likely reflects the exploration of new geographic areas that are yielding many new and different specimens of plesiosaurs such as China, Norway, Canada and South America (e.g., Aristonectes quiriquiensis from Chile; Otero et al. 2014). However, renewed focus on the rich plesiosaur fossil records of those countries that have historically yielded many plesiosaur specimens, such as the United Kingdom and Germany, has also led to a wave of new discoveries (e.g., Annigasaura lymense; Vincent and Benson 2012). Current rates of discovery for new plesiosaur species are therefore more rapid than at any previous point in time and there is no indication yet that we are anywhere near exhausting our understanding of plesiosaur diversity.
The weak negative correlation between plesiosaur SCM and year of description apparently results from the scarcity of very complete (>90% complete) plesiosaur skeletons among those species described relatively recently. This significant relationship holds for both SCM1 and SCM2. There are at least two (not mutually exclusive) possible explanations of this result. One is that palaeontologists might be more willing to name plesiosaurs on more incomplete remains today than in the past, and this might reflect changes in taxonomic practice or the ability to better distinguish species based on the increasing knowledge of plesiosaur anatomy and phylogeny. Alternatively, it might be that for those species that were named earlier, there have been greater opportunities for palaeontologists to discover additional specimens, increasing completeness for older taxa. This is complicated by the fact that our dataset only includes those species considered valid today, so many historically named species, which may have been defined on inadequate material, are not included. In any case, the strength of the correlation is extremely weak, and explains only a small proportion of the signal present in plesiosaur completeness data.
Conclusions
Our results recover a strong significant positive correlation between CCM and SCM, suggesting that, at least for plesiosaurs, the two metrics are recording the same signal. This suggests that it might only be necessary to calculate one of these metrics for future studies, but future comparisons of CCM and SCM across multiple clades would be desirable to assess the broader applicability of this observation, including groups where cladistic datasets are focused heavily on particular skeletal regions (e.g., clades where cladistic characters are defined mostly from the skull).
Our analyses using the full datasets did not recover a significant correlation between changes in sea level and changes in plesiosaur completeness. However, scatterplots and statistical comparisons suggest that an underlying negative correlation between sea level and plesiosaur completeness may be present, but obscured by poorly sampled time bins. If correct, this matches a previously identified significant negative correlation between ichthyosaur completeness and sea level, and suggests common, sea level driven controls on completeness in the marine realm, but the exact causal mechanism for this relationship requires further investigation. Future work should focus on assessing whether this correlation between skeletal completeness and sea level is shared across other marine groups (e.g., mosasaurs, marine crocodylomorphs).
Plesiosaur completeness is not correlated with either observed species richness or fossil record sampling proxies, suggesting that skeletal completeness does not represent a major sampling bias in the plesiosaur record, at least in the sense of biasing our understanding of diversity change. Plesiosaur completeness though time is not significantly correlated with that for contemporary terrestrial groups (sauropods, pterosaurs, birds), but is significantly correlated with that for ichthyosaurs. Median completeness values for plesiosaurs and ichthyosaurs were significantly higher than in contemporary terrestrial groups, supporting the hypothesis that the marine tetrapod fossil record is more complete than that of terrestrial tetrapods. However, none of the contemporary terrestrial groups for which comparative data was available are ideal comparisons to plesiosaurs and ichthyosaurs, and future comparisons to other dinosaur clades (e.g., ornithischians, theropods) will be needed for more comprehensive comparisons of marine and terrestrial skeletal completeness.
The collector’s curve for plesiosaurs shows a generally slow constant rate of discovery from the latter part of the 19th century until the 1990s. From the 1990s onwards the rate of discovery increased substantially and shows no sign of slowing. Current discovery rates exceed those at any previous point in time, and reflect recent exploration of new geographic areas and geological basins, as well as intense re-evaluation of historical specimens.
Acknowledgements
Initial data collection and analyses were completed as part of a third-year research project by SLT at the University of Birmingham supervised by RJB. We thank Terri Cleary (Natural History Museum, London, UK) and Christopher Dean (Imperial College London, UK) for constructive and thoughtful review comments that improved the final manuscript. RJB received funding from the European Union’s Horizon 2020 research and innovation programme 2014–2018 under grant agreement 637483 (ERC Starting Grant: TERRA). This is Paleobiology Database official publication 286.
References
Alroy, J. 2010. Geographical, environmental and intrinsic biotic controls on Phanerozoic marine diversification. Palaeontology 53: 1211–1235. Crossref
Behrensmeyer, A.K., Kidwell, S.M., and Gastaldo, R.A. 2000. Taphonomy and paleobiology. Paleobiology 26: 103–147. Crossref
Bell, M.A. and Lloyd, G.T. 2015. Strap: an R package for plotting phylogenies against stratigraphy and assessing their stratigraphic congruence. Palaeontology 58: 379–389. Crossref
Benjamini, Y. and Hochberg, Y. 1995. Controlling the false discovery rate: a practical and powerful approach to multiple testing. Journal of the Royal Statistical Society. Series B (Methodological) 57: 289–300.
Benson, R.B.J. and Butler, R.J. 2011. Uncovering the diversification history of marine tetrapods: ecology influences the effect of geological sampling biases. Geological Society, London, Special Publications 358: 191–208. Crossref
Benson, R.B.J. and Druckenmiller, P.S. 2014. Faunal turnover of marine tetrapods during the Jurassic–Cretaceous transition. Biological Reviews 89: 1–23. Crossref
Benson, R.B.J, Bates, K.T., Johnson, M.R., and Withers, P.J. 2011. Cranial anatomy of Thalassiodracon hawkinsii (Reptilia, Plesiosauria) from the Early Jurassic of Somerset, United Kingdom. Journal of Vertebrate Paleontology 31: 562–574. Crossref
Benson, R.B.J., Butler, R.J., Lindgren, J., and Smith, A.S. 2010. Mesozoic marine tetrapod diversity: mass extinctions and temporal heterogeneity in geological megabiases affecting vertebrates. Proceedings of the Royal Society B: Biological Sciences 277: 829–834. Crossref
Benson, R.B.J., Evans, M., and Druckenmiller, P.S. 2012. High diversity, low disparity and small body size in plesiosaurs (Reptilia, Sauropterygia) from the Triassic–Jurassic Boundary. PLoS ONE 7: e31838. Crossref
Benson, R.B.J., Evans, M., Smith, A.S., Sassoon, J., Moore-Faye, S., Ketchum, H.F., and Forrest, R. 2013. A giant pliosaurid skull from the Late Jurassic of England. PLoS ONE 8: e65989. Crossref
Benton, M.J., Dunhill, A.M., Lloyd, G.T., and Marx, F.G. 2011. Assessing the quality of the fossil record: insights from vertebrates. Geological Society, London, Special Publications 358: 63–94. Crossref
Brocklehurst, N. and Fröbisch, J. 2014. Current and historical perspectives on the completeness of the fossil record of pelycosaurian-grade synapsids. Palaeogeography, Palaeoclimatology, Palaeoecology 399: 114–126. Crossref
Brocklehurst, N., Upchurch, P., Mannion, P.D., and O’Connor, J. 2012. The completeness of the fossil record of Mesozoic birds: implications for early avian evolution. PLoS ONE 7: e39056. Crossref
Brown, D., Vincent, P., and Bardet, N. 2013. Osteological redescription of the skull of Microcleidus homalospondylus (Sauropterygia, Plesiosauria) from the Lower Jurassic of England. Journal of Paleontology 87: 537–549. Crossref
Butler, R.J., Benson, R.B.J., Carrano, M.T., Mannion, P.D., and Upchurch, P. 2011. Sea level, dinosaur diversity and sampling biases: investigating the ‘common cause’ hypothesis in the terrestrial realm. Proceedings of the Royal Society B: Biological Sciences 278: 1165–1170. Crossref
Cleary, T.J., Moon, B.C., Dunhill, A.M., and Benton, M.J. 2015. The fossil record of ichthyosaurs, completeness metrics and sampling biases. Palaeontology 58: 521–536. Crossref
Conybeare, W. 1822. IX. Additional notices on the fossil genera Ichthyosaurus and Plesiosaurus. Transactions of the Geological Society of London 2: 103–123. Crossref
Cope, E.D. 1869. On some reptilian remains. American Journal of Science. Series 2 48: 278.
Dean, C.D., Mannion, P.D., and Butler, R.J. 2016. Preservational bias controls the fossil record of pterosaurs. Palaeontology 59: 225–247. Crossref
Druckenmiller, P.S. 2002. Osteology of a new plesiosaur from the Lower Cretaceous (Albian) Thermopolis Shale of Montana. Journal of Vertebrate Paleontology 22: 29–42. Crossref
Druckenmiller, P.S. and Russell, A.P. 2008. A phylogeny of Plesiosauria (Sauropterygia) and its bearing on the systematic status of Leptocleidus Andrews, 1922. Zootaxa 1863: 1–120.
Großmann, F. 2007. The taxonomic and phylogenetic position of the Plesiosauroidea from the Lower Jurassic Posidonia Shale of south-west Germany. Palaeontology 50: 545–564. Crossref
Haq, B.U., Hardenbol, J., and Vail, P.R. 1987. Chronology of fluctuating sea levels since the Triassic. Science 235: 1156–1167. Crossref
Kear, B.P. and Barrett, P.M. 2011. Reassessment of the Lower Cretaceous (Barremian) pliosauroid Leptocleidus superstes Andrews, 1922 and other plesiosaur remains from the nonmarine Wealden succession of southern England. Zoological Journal of the Linnean Society 161: 663–691. Crossref
Kear, B.P., Schroeder, N.I., and Lee, M.S. 2006. An archaic crested plesiosaur in opal from the Lower Cretaceous high-latitude deposits of Australia. Biology Letters 2: 615–619. Crossref
Ketchum, H.F. and Benson, R.B.J. 2010. Global interrelationships of Plesiosauria (Reptilia, Sauropterygia) and the pivotal role of taxon sampling in determining the outcome of phylogenetic analyses. Biological Reviews 85: 361–392. Crossref
Mannion, P.D. and Upchurch, P. 2010. Completeness metrics and the quality of the sauropodomorph fossil record through geological and historical time. Paleobiology 36: 283–302. Crossref
Miller, K.G., Kominz, M.A., Browning, J.V., Wright, J.D., Mountain, G.S., Katz, M.E., Sugarman, P.J., Cramer, B.S., Christie-Blick, N., and Pekar, S.F. 2005. The Phanerozoic record of global sea-level change. Science 310: 1293–1298. Crossref
O’Gorman, J.P., Salgado, L., Olivero, E.B., and Marenssi, S.A. 2015. Vegasaurus molyi, gen. et sp. nov. (Plesiosauria, Elasmosauridae), from the Cape Lamb Member (lower Maastrichtian) of the Snow Hill Island Formation, Vega Island, Antarctica, and remarks on Wedellian Elasmosauridae. Journal of Vertebrate Paleontology 35: e931285. Crossref
O’Keefe, F.R. 2001. A cladistic analysis and taxonomic revision of the Plesiosauria (Reptilia: Sauropterygia). Acta Zoologica Fennica 213: 1–63
O’Keefe, F.R. 2002. The evolution of plesiosaur and pliosaur morphotypes in the Plesiosauria (Reptilia: Sauropterygia). Paleobiology 28: 101–112. Crossref
O’Keefe, F.R. 2004. Preliminary description and phylogenetic position of a new plesiosaur (Reptilia: Sauropterygia) from the Toarcian of Holzmaden, Germany. Journal of Paleontology 78: 973–988. Crossref
O’Keefe, F.R., Street, H., Cavigelli, J.P., Socha, J.J., and O’Keefe, R.D. 2009. A plesiosaur containing an ichthyosaur embryo as stomach contents from the Sundance Formation of the Bighorn Basin, Wyoming. Journal of Vertebrate Paleontology 29: 1306–1310. Crossref
Otero, R.A., Soto-Acuña, S., Vargas, A.O., Rubilar-Rogers, D., Yury-Yáñez, R.E., and Gutstein, C.S. 2014. Additions to the diversity of elasmosaurid plesiosaurs from the Upper Cretaceous of Antarctica. Gondwana Research 26: 772–784.
Smith, A.S. 2015. Reassessment of “Plesiosaurus” megacephalus (Sauropterygia: Plesiosauria) from the Triassic–Jurassic boundary, UK. Palaeontologia Electronica 18: 1–20.
Smith, A.S. and Dyke, G.J. 2008. The skull of the giant predatory pliosaur Rhomaleosaurus cramptoni: implications for plesiosaur phylogenetics. Naturwissenschaften 95: 975–980. Crossref
Storrs, G.W. 1984. Elasmosaurus platyurus and a page from the Cope-Marsh war. Discovery 17: 25–27.
Verrière, A., Brocklehurst, N., and Fröbisch, J. 2016. Assessing the completeness of the fossil record: comparison of different methods applied to parareptilian tetrapods (Vertebrata: Sauropsida). Paleobiology 42: 680–695. Crossref
Vincent, P. 2011. A re-examination of Hauffiosaurus zanoni, a pliosauroid from the Toarcian (Early Jurassic) of Germany. Journal of Vertebrate Paleontology 31: 340–351. Crossref
Vincent, P. 2012. Re-description of a basal plesiosaur (Reptilia, Sauropterygia) from the Lower Jurassic of England. Journal of Paleontology 86: 167–176. Crossref
Vincent, P. and Benson, R.B.J. 2012. Anningasaura, a basal plesiosaurian (Reptilia, Plesiosauria) from the Lower Jurassic of Lyme Regis, United Kingdom. Journal of Vertebrate Paleontology 32: 1049–1063. Crossref
Walther, M. and Fröbisch, J. 2013. The quality of the fossil record of anomodonts (Synapsida, Therapsida). Comptes Rendus Palevol 12: 495–504. Crossref
Acta Palaeontol. Pol. 62 (3): 563–573, 2017
https://doi.org/10.4202/app.00355.2017