
Isometry in mesosaurs: Implications for growth patterns in early amniotes
PABLO NÚÑEZ DEMARCO, JORGE FERIGOLO, and GRACIELA PIÑEIRO
Núñez Demarco, P., Ferigolo, J., and Piñeiro, G. 2022. Isometry in mesosaurs: Implications for growth patterns in early amniotes. Acta Palaeontologica Polonica 67 (2): 509–542.
Mesosaurs were small amphibious tetrapods that lived in western Gondwana during the early Permian or even earlier, when temperate Carboniferous–Permian conditions initiated after the glaciations that affected the southern region of Pangea. In this contribution, we applied traditional linear regression morphometrics to analyse proportions of both the skull and limb bones in more than 100 mesosaur specimens. The analyses revealed that all mesosaur bones scale remarkably close to a model of geometrical similarity (isometry), and that this pattern is particularly strong in long bones and also in the skull. These results indicate that juvenile and adult mesosaurs do not display appreciable change in bone proportions, meaning that there are few or no noticeable differences between them during growth. The well-defined isometry, and particularly, the high interrelation between metatarsals and phalanges permit us to suggest that the mesosaur hind limb is subject to notable modularity. This evidence strongly argues that the differences previously described to support three mesosaur species in Western Gondwana, might instead reflect natural intraspecific variability, taphonomic features or even possible sexual dimorphism, as recently suggested. Our study also reinforces the general plesiomorphic structure of the mesosaur skeleton, which along with some cranial specializations for ecological fitness and the evidence of strong isometric growth as we demonstrate herein, may suggest new hypotheses of relationships for mesosaurs which thus would position them as more basal amniotes than previously thought.
Key words: Mesosauridae, Mesosaurus tenuidens, allometry, morphometrics, Permian, Gondwana, Pangea.
Pablo Núñez Demarco [pnunez@fcien.edu.uy], Instituto de Ciencias Geológicas, Facultad de Ciencias, Universidad de la República, Montevideo, Uruguay; InGeBa, Facultad de Ciencias Exactas y Naturales, Universidad de Buenos Aires (UBA), Intendente Güiraldes 2160, Buenos Aires, Argentina.
Jorge Ferigolo [jorgeferigolo@gmail.com], Seção de Paleontologia, Museu de Ciências Naturais, Secretaria do Meio Ambiente e Infraestrutura do Rio Grande do Sul (SEMA), Rua Salvador França, 1427-90 690-000, Porto Alegre, RS, Brazil.
Graciela Piñeiro [fossil@fcien.edu.uy], Departamento de Paleontología, Facultad de Ciencias, Iguá 4225. CP. 11400. Montevideo, Uruguay.
Received 29 July 2021, accepted 8 November 2021, available online 16 February 2022.
Copyright © 2022 P. Núñez Demarco et al. This is an open-access article distributed under the terms of the Creative Commons Attribution License (for details please see http://creativecommons.org/licenses/by/4.0/), which permits unrestricted use, distribution, and reproduction in any medium, provided the original author and source are credited.
Introduction
Mesosaurs have been considered as the oldest known aquatic amniotes (Mac Gregor 1908; Romer 1966; Araújo 1977; Oelofsen 1981; Oelofsen and Araújo 1987; Carroll 1982; Laurin and Reisz 1995; Modesto 1996, 1999, 2006, 2010; Piñeiro 2002, 2006, 2008; Canoville and Laurin 2010; Piñeiro et al. 2012a–c, 2016; Villamil et al. 2015), but recent morphometric and anatomical studies have suggested that they were more adapted to a semiaquatic life (Núñez Demarco et al. 2018). They lived in the area occupied by a large and shallow water body at the southwest of Pangea during the early Permian (e.g., Santos et al. 2006) or even close to the Carboniferous–Permian transition (e.g., Huene 1940, 1941; Calisto and Piñeiro 2019), spreading through what today are the territories of Namibia, South Africa, south and central Brazil, southeastern Paraguay and northeastern Uruguay (Wegener 1966).
Mesosaurs are of interest to palaeontologists because they might represent the first amniotes that returned to the aquatic environment (Carroll 1988), although they seem to support other hypotheses that suggested that their ancestors also were aquatic or semiaquatic (Romer 1957). Moreover, in a phylogenetic context they were recently found to be the basalmost sauropsids (e.g., Laurin and Buffrénil 2016; Laurin and Piñeiro 2017, 2018), although other results place them as the basalmost parareptiles (e.g., Modesto 1999; Piñeiro et al. 2012a, b; Tsuji et al. 2012; Modesto et al. 2015; Mac Dougall et al. 2018).
Morphological changes during the ontogeny of a species are often assumed to be adaptive, being modelled by natural selection and by the complex process of growth (Mitteroecker and Bookstein 2007). Divergent selection usually generates phenotypic differences among populations and species, and appendicular synapomorphies related to locomotor adaptations are the frequent targets of studies focusing on the assessment of tetrapod evolution and paleobiology (Bonnan 2004, 2007; Bonnan et al. 2008; Olori 2013).
Mesosaurs provide an interesting opportunity to examine the influence of selection in the developmental and morphological patterns observed through ontogeny. Usually, analyses performed on extinct taxa inherently suffer from difficulties related to completeness, type of preservation and poor taxonomic samples. However, mesosaurs are known from hundreds of complete and articulated individuals and thousands of incomplete and isolated specimens that make them an exceptional case study.
A recent revision of the diagnostic characters that support a taxonomic composition of three taxa within Mesosauridae arrived at the conclusion that only one taxon can be unambiguously recognized, which by priority is Mesosaurus tenuidens Gervais, 1865 (Piñeiro et al. 2021). Therefore, we will refer only to this taxon when we refer to mesosaurus.
In this contribution we performed a geometric-morphometric study of cranial and postcranial regions of the mesosaur skeleton, in order to investigate if there are statistically significant morphological differences through ontogenetic development among mesosaurs coming from Brazil, Africa, and Uruguay. We also compared our results, mainly for the postcranial region, to the aquatic to semiaquatic reptile Hovasaurus boulei Piveteau, 1926, from the Permian of Madagascar to test the influence of lifestyle on the construction of the limbs and on the functional patterns of growth. We also discuss the phylogenetic implications of the developmental pattern found in mesosaurs with respect to recent new hypotheses that consider recumbirostran “microsaurs” as basal amniotes (Pardo et al. 2017; Mann et al. 2019, 2020).
In this paper we start with a review of the basic methodology. The available morphometric data will be presented next: starting with the measurements of the skulls, to investigate the relation of some cranial bones and regions to the postcranium. Subsequently, the internal relationships of the postcranial bones are analysed, ending with comparison of relationships between different bones (with the major focus upon the stylopodia and zeugopodia). We used a traditional morphometric approach with the aim of (i) determining whether statistically significant morphological differences occur among mesosaurs, and (ii) inferring functional and evolutionary implications from the observed patterns. Measurements of the skull, vertebrae and all the limb bones of more than 100 mesosaur specimens were taken, although, our study will concentrate on limb bone dimensions, as they are often the most frequently and best preserved skeletal elements in the mesosaur fossil record.
Next, the morphology of the mesosaur carpus and its changes observed through the ontogeny were reappraised, followed by an analysis of the ontogenetic transformation of the tarsus in accordance with size, maturity and ossification degree of the different elements.
Subsequently, we focus on the morphometry and relations of the metapodia and phalanges, comparing the results obtained for M. tenuidens and the aquatic or semiaquatic late Permian diapsid H. boulei from Madagascar. Finally, we discuss the isometric growth observed during mesosaur ontogeny in a phylogenetic context and in light of recently proposed new hypotheses, which may represent particularly relevant findings for a better understanding of early tetrapod evolution and paleobiology.
Institutional abbreviations.—AMNH, American Museum of Natural History, New York, USA; FC-DPV, Fossil Vertebrates of the Facultad de Ciencias, Montevideo, Uruguay; GP/2E and PF, Instituto de Geociências (Palaeontology Sector) of the São Paulo University, São Paulo, Brazil; GSN-F, National Earth Science Museum at the Geological Survey of Namibia, Windhoek Namibia; MCN, Museu de Ciências Naturais (SEMA), Porto Alegre, Brazil; MN, Museu Nacional-Universidade Federal do Rio de Janeiro, Brazil; MNHN, Museum National d’Histoire Naturelle of Paris, France; PIMUZ,Palaeontological Institute and Museum, University of Zurich, Switzerland; SMF-R, Senckenberg Institute, Frankfurt, Germany.
Other abbreviations.—GM, geometric mean regression; MA, standardized major axis; OLS, ordinary least squares; RMA, reduced major axis.
Material and methods
We examined a total of 109 mesosaur specimens preserved in different ontogenetic stages, including unborn to young and several very mature individuals.
Specimens revised and analysed in this study belong to six collections, from seven countries: AMNH, FC-DPV, GP/2E and PF, GSN-F, MCN, MNHN, and SMF-R. The available specimens housed in these institutions come from the following lithostratigraphic units: Irati Formation (Brazil), Whitehill Formation (South Africa), Huab Formation (Namibia), and the Mangrullo Formation (Uruguay).
A brief description of the studied specimens and their institutional repositories is provided in the SOM: table 1 (Supplementary Online Material available at http://app.pan.pl/SOM/app67-NunezDemarco_etal_SOM.pdf).
Preservation and measurements of the specimens.—The studied specimens come from silstone, shale, and from limestone-dolostone deposits. The specimens from the limestone and shale are mostly preserved as external moulds, impressions or casts, whereas permineralized half-buried bones and skeletons come from the limestone and dolostones. 3D measurements from the latter could not be taken accurately, because this preservation does not allow removal of the bones from the matrix without damaging them. Long bones are mainly elliptical in their mid-diaphyseal cross section (the femur is somewhat triangular) and are almost always resting in similar positions with the long axis parallel to the sedimentary layers, even if the specimen is resting in lateral view. Therefore, 2D measurements are a good approximation to the real dimensions and the maximum length and width can be obtained confidently.
Mesosaur specimens were photographed, and 2D measurements were taken using the digital images, with an error of 0.1 mm. The selected specimens are articulated or semi-articulated skeletons in which the anatomical position of the bones was known, or could be determined.
Our study focuses mainly on the postcranial region of Mesosaurus tenuidens, because a considerable number of specimens preserving the skull are severely damaged; despite this, we could obtain reliable statistical results by measuring 39 mesosaur skulls. The skull length from the tip of the snout to the posterior edge of the postparietals, the skull maximum width, the snout length from the tip of the snout to the orbit, the snout width, and the length between the posterior border of orbit and the posterior border of the skull were measured. Moreover, we compared the skull length in relation to the growth of some postcranial bones through different ontogenetic stages, and these measures were compared with the mean of the centrum length along the available vertebrae in each specimen. The mean centrum length was calculated for the neck, trunk, and tail regions and also for the entire body (data and measurements for analyses of centrum length patterns were provided in Núñez Demarco et al. 2018). Knowing the total number of vertebrae of mesosaurs (~101) and multiplying it by the mean centrum length, it is possible to estimate the total length of the specimens. Núñez Demarco et al. (2018) showed that this calculation is more accurate if the mean centrum length is used instead of the length of one specific vertebra or vertebral segment (e.g., sacral vertebrae).
In the postcranial region, measurements of the appendicular skeleton were prioritized, as these bones are well represented, both in articulated specimens and as isolated elements, thus guaranteeing a good sample size for statistical tests.
Total length was measured in all long bones (humerus, radius, ulna, femur, tibia, fibula, metacarpals, metatarsals, and phalanges; see Fig. 1). Maximum diameter of the proximal and distal bone ends (epiphyses are mostly cartilaginous) and minimum midshaft (diaphysis) diameter were measured for the humerus, radius, ulna, femur, tibia and fibula. Only the diameter of the first metatarsal proximal epiphysis (mostly ossified) was measured. Disarticulated phalanges that could not be assigned to a specific toe were excluded.
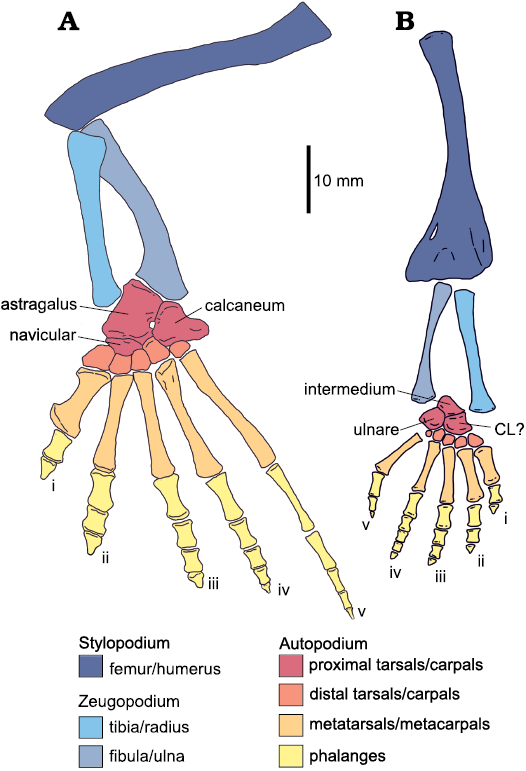
Fig. 1. Anatomical reconstruction of pes/hindlimb (A) and manus/forelimb (B) in an adult Mesosaurus tenuidens Gervais, 1865. Colours indicate the identity of the different elements that form the limbs. CL?, lateral centrale? (ontogenetic development of this bone is discussed in detail in the carpus section); I–V, finger/toe numbers. Modified from Piñeiro et al. (2016).
Additionally, astragalus length and width in its proximal, central and distal regions, and calcaneum length and width in its central portion, were measured (length was measured from the anterior point of the bone to its most posterior point).
Measured regions are indicated in the corresponding figures. Elements from both sides of the body (when available), were measured to provide better sample sizes for the analyses. Therefore, in some of the performed test some individuals may be represented by two sampled points. To avoid any confusion, the number of samples and the number of individuals sampled was indicated in every analysis.
Anatomical identification of the limb bones at the zeugopodial region is difficult to assess if they are preserved in isolation, since radius and ulna can be mistaken for metapodials of larger specimens (Fig. 1).
To complete the morphometric study and for comparative purposes, we also analyzed 30 articulated specimens of Hovasaurus boulei preserving the hind limbs. Hovasaurus boulei is an early diapsid from the upper Permian sequences of south-western Madagascar (Carroll 1981, 1982; Currie 1981; Caldwell 1994, 2002) which possesses similar aquatic adaptations to mesosaurs, except for development of pachyosteosclerotic ribs in the latter. Hovasaurus boulei is known from a large number of articulated and almost complete skeletons with very good preservation of the hind limb components, which allowed Caldwell (1994, 2002) to study the ossification patterns of this taxon through the ontogeny. Limb measurements for 30 specimens of H. boulei were taken from drawings of Carroll (1981) and Currie (1981) and from photographs of the specimens deposited in the collection of the MNHN, taken by a colleague of our research group (see Fig. 2).
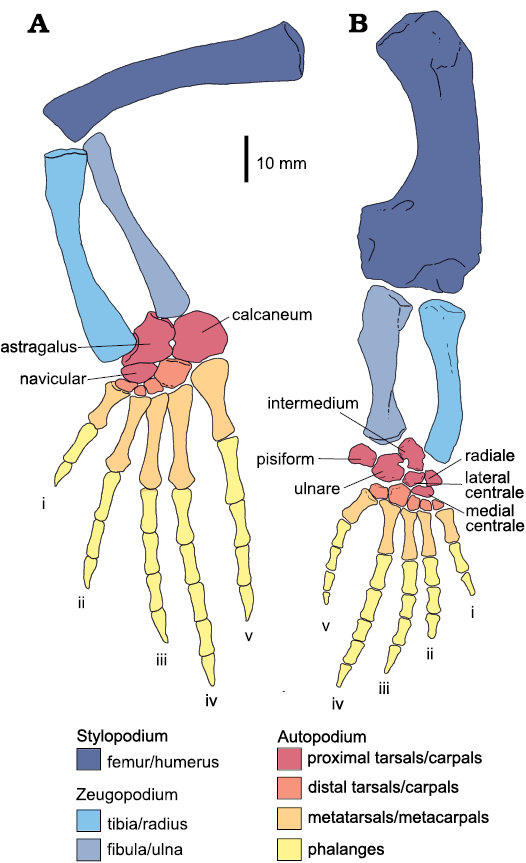
Fig. 2. Anatomical reconstruction of pes/hindlimb (A) and manus/forelimb (B) in an adult Hovasaurus boulei Piveteau, 1926. Colours indicate the identity of the different elements that form the limbs. I–V, finger/toe number. Based on Currie (1981) and Caldwell (1997).
Allometric equation.—Changes between parts of an organism and their proportions are generally described by the allometric equation (Snell 1892; Huxley 1924), given by a power law formula:
y = bxa (1)
where y and x are variables that express the dimension of some parts or components, b is a constant, and a is the law’s exponent, or in this case, the allometric coefficient. This equation implies that change in one quantity (x) results in a proportional relative change in another (y). This expression can be easily simplified applying a logarithmic transformation to get:
log (y) = log (x)a + log (b) (2)
This last expression has the advantage of being a line with slope equal to a, but using the original variables on a logarithmic scale. Thus, the coefficient a reflects the intensity of differential growth between the different parts. This coefficient can be determined by a linear regression of the variables x and y.
More precisely, bivariate relationships are identified as isometric if the 95% confidence interval of the slope of equation (2), includes 1 (e.g., Rubenstein 1971; Leduc 1987; Anderson et al. 2016). If a >1, then y grows faster than x (positive allometry) and if a <1, x grows faster than y (negative allometry). Meanwhile, a non-linear relationship between the two variables may imply changes in the growth rate during ontogeny.
Despite the apparent simplicity of the method, it requires some cautions and considerations as follows:
– For the linear adjustment to be valid there must be a good or strong correlation between the two variables. Usually, correlations with r-squared values higher than 0.70, are considered strong and reliable.
– The regression method to define a line of best fit between x and y, also should be considered carefully. Two methods are usually considered; the ordinary least squares (OLS) and the reduced major axis (RMA). The last one is also known as the standardized major axis (MA) or the geometric mean regression (GM). OLS assumes that x is the independent measurement known without error, and all error is attributed to the y variable, being the dependent measurement or error in y—very much higher than error in x. Instead, RMA assumes that both, x and y were measured with error, but, above all, RMA is symmetric, meaning that the slope of the regression of x on y and of y on x are the same. Meanwhile, OLS is asymmetric, meaning that the result will change depending on which variable is identified as x and which as y (Smith 2009). In morphometric analyses, both variables commonly have measurement errors, usually the same error. Although this error can be minimized, there is an unknown noise introduced by taphonomy, which is always an important factor in palaeontology. Moreover, as we are trying to calculate allometric relationships—a mutual, co-dependent law underlying x and y relationship, the selection of which variable will be on the x axis and which on the y axis is arbitrary. Additionally, we have to pursue a solution with a symmetric interpretation capable of predicting cases that fall outside of the domain of the regression. In such conditions, RMA is recommended (Leduc 1987; Ricker 1973; Bonnan et al. 2008; Smith 2009). In this work, RMA curves were calculated using the Matlab program developed by Trujillo-Ortiz and Hernandez-Walls (2010). The confidence intervals were calculated using both Ricker (1973) and Jolicoeur and Mosimann (1968) and McArdle (1988) procedures available in the same program. As the results are practically similar, we show only the later one in the plots.
– Another issue is the log transformation of the data. As previously shown, logarithm is applied to the data to solve Equation 1 and to calculate a coefficient. However, logarithm is commonly applied in biological sciences to normalize the data, to reduce the skewness of the distribution and to reduce variability, especially data that include outlying observations (Zar 1999; Feng et al. 2014). Normalization is also a necessary condition for OLS and RMA. However, as Feng et al. (2014) have demonstrated, if the data already have a normal distribution, the log transformation can produce a non-normal distribution and even increased variability. In our case, the mesosaur data have a normal distribution and then log-transformation is not recommended. To solve this contradiction, we applied the procedure two times. Firstly, we log-transformed data in order to calculate coefficient a. If the data satisfy the condition that the 95% confidence interval includes 1, then the growth is isometric, and the allometric equation becomes:
y = bx + c (3)
where b is the slope of the curve, c is a constant and both x and y grow at the same rate (isometry). Thus, we recalculated the linear adjustment of the data without log-transformation of the data, in order to establish a more reliable relationship between the variables. All the linear plots presented in this work use non-logarithmic data, following Equation 3, but each plot is linked to the values of the constant a calculated with logarithmic data. This also has the advantage that data and plots can be directly analyzed and interpreted (Feng et al. 2014).
– Finally, we must be able to ensure that the sampling distribution is statistically significant; something that is not easy in palaeontology. In our case we can assume that (i) the sampled mesosaurs are a random and representative sample of the population. This is strengthened by the fact that we studied samples collected throughout the Irati, Mangrullo, and Whitehill formations, at different levels and lithologies, and that were collected by different people. (ii) All the mesosaurs are likely to be representative cross-section of the mesosaur population. Different sizes and ontogenetic stages have been already recognized in most of the studied samples (Piñeiro et al. 2016, 2021), so it can be assured that various groups of different ages are represented. (iii) Bone dimensions correctly represent the actual dimensions of the mesosaurs from which they derived.
As in similar works (e.g., Bonnan 2004, 2007; Bonnan et al. 2008; Olori 2013), we plotted bone length against bone width to obtain allometric profiles for each bone. In addition, we compared different bone measurements to observe their allometric relationships. In other words, bivariate relationships between intra- and inter-bone dimensions were examined. Further, we compared the results with data provided by the studied H. boulei specimens, in order to observe similarities and differences.
It is important to clarify that most of the appendicular mesosaur elements display a simple morphology with few discernible landmarks making them unsuitable for a geometric morphometric study. A notable exception is the humerus of the mesosaurs. However, such analysis is beyond the scope of the present study and will constitute a separate contribution.
To test our allometry results and verify that these are not simply the result of the chosen samples, the data were resampled uniformly at random, with replacement, 100,000 times (e.g., Kowalewski and Novack-Gottshall 2010). The result of each resampling was analyzed and compared with the original result (for log transformed data), as well as the average result of the resampling. This bootstrap method is particularly important to know how much the sample statistic varies, and to assess the uncertainty surrounding it.
Results
Isometry
Linear adjustments made with log transformed data show that mesosaurs display a strong correlation and isometry (Figs. 3–10). This kind of growth is observed in the skull and also in the postcranial region, particularly marked at the vertebral column, and at the fore and hind limbs (see also SOM: table 2).
The isometry of the mesosaur skull.—Figure 3A–F summarizes the relationships between different dimensions of thirty-nine mesosaur skulls and the statistical parameters of the analysis. Skull length and snout length (Fig. 3B) have an isometric relationship with the most intense correlation. This is probably because the snout length is a substantial part of the skull length. Curiously, when the quantity “skull length minus snout length” is plotted against skull length, the relation is also isometric (Fig. 3B, square dots). Moreover, all the dimensions measured have isometric slopes (Fig. 3G), the only exception is when comparing the skull length and the orbit length (Fig. 3C) where the 95% interval did not include 1, although the value is remarkably close to 1. The relationship in this case resents a slight negative allometry (but see below). The back of the skull and the orbits are among the elements that display the greatest taphonomic deformation due to compaction during diagenesis. Therefore, it is expected that these elements exhibit greater noise and a lower correlation as it can be seen in Fig. 3C, D, and H. Curiously, the orbit length vs. the maximum width of the skull have an isometric relationship (Fig. 3F), possibly because both elements were uniformly distorted. If orbits and snout are not deformed equally during compaction, that could explain the low correlation and lack of isometry between the length of both the skull and the orbit (Fig. 3C). The bootstrap analysis reinforces these results (SOM: table 2). Moreover, all the parameters including skull length and the orbit length include 1 in their confidence intervals, and therefore they can be considered isometric. However, skull length and the orbit length display great variability. For example, for these particular variables, only 41% of the 100,000 re-samples do include the number 1 in their 95% interval. This result does not change the fact that the average result of the resampling and its confidence interval do include 1, but reflects a higher uncertainty level among these measurements, probably related to taphonomic artifacts as mentioned earlier.
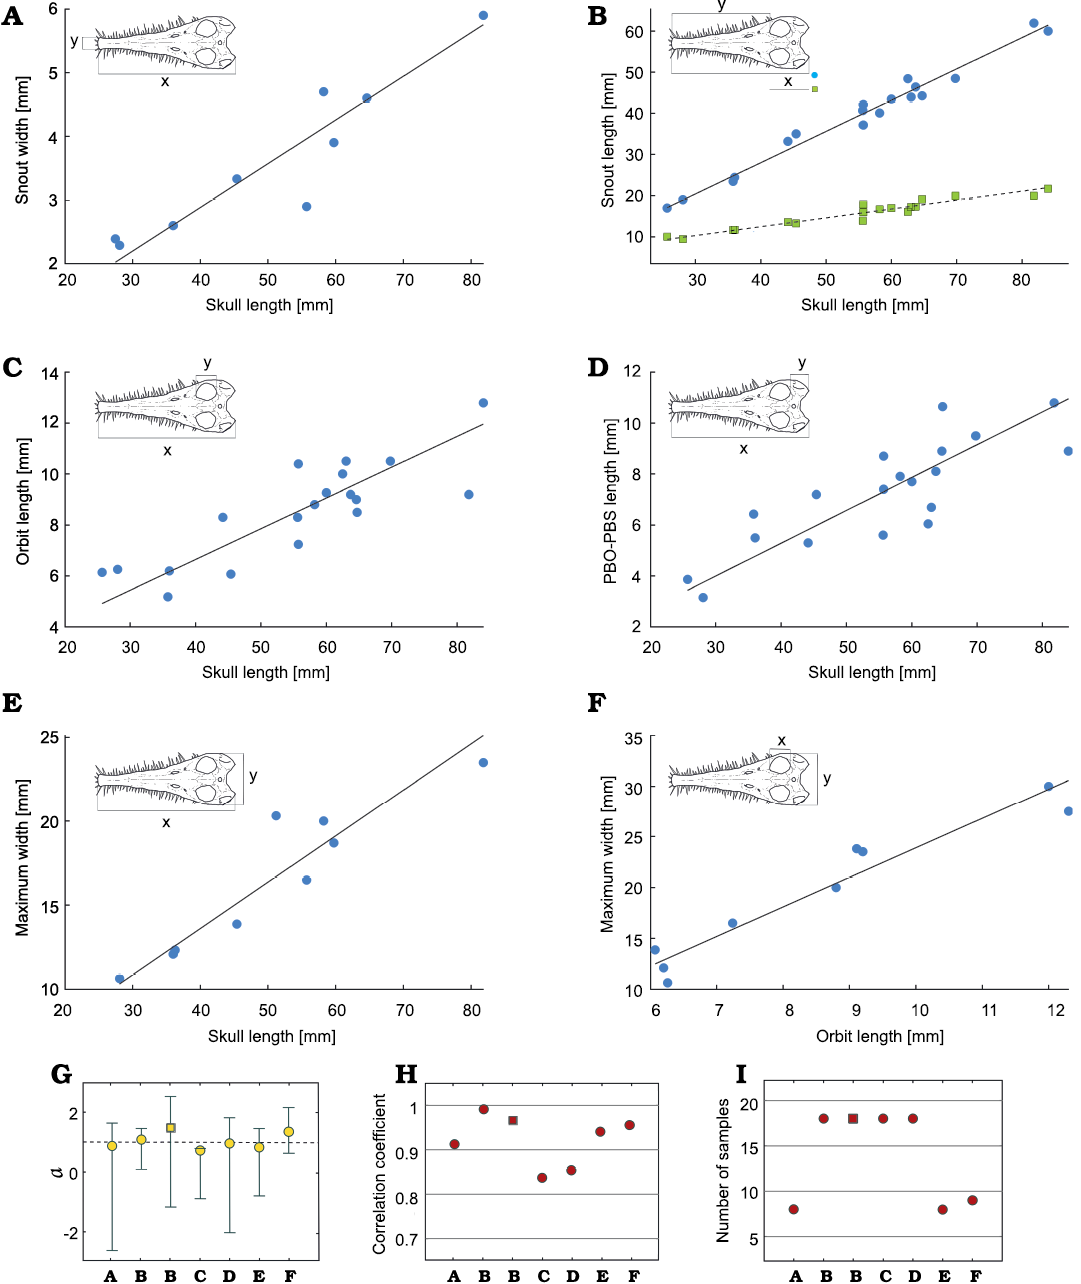
Fig. 3. Relationships found in different regions of the skull of Mesosaurus tenuidens Gervais, 1865. Snout width (A) and length (B) vs. skull length; squares in B, G–I: skull length minus snout length. Orbit length (C) and PBO-PBS (length between the posterior border of orbit and the posterior border of the skull) (D) vs. skull length. Maximum skull width vs. skull length (E) and orbit length (F). The measured regions are indicated in the upper left corner of each figure; x and y indicate the axis on which the measurement is plotted. G–I. Respective statistical parameters for A–F: coefficient a and its 95% confidence interval (G), correlation coefficient (H), number of samples (I).
Isometry of the postcranial bones.—The relationship between the length and width of the different long bones in mesosaurs has a correlation coefficient higher than 0.7 and gives values of coefficient a close to 1. Figure 4 summarizes all the statistical intra-bone relationships of the measured bones, calculated using logarithmic data (Equation 2). All the 95% confidence intervals included 1, except for the astragalus, although it is still very close to 1 (Fig. 4A). This is not unexpected given that this bone has a more delayed ossification process (including a late fusion with the navicular) which can be observed along its growth (Piñeiro et al. 2016). Figures 5 and 6, show the linear plots (according to Equation 3) for stylopodium and zeugopodium of forelimbs and hind limbs respectively; these figures also show these regions measured in each bone. The resampling statistics emphasize the previous results (SOM: table 2). All the resampling means have values closer to 1 with confidence intervals that include 1. Even the mean correlation coefficient of nearly all the resamples is greater than to 0.7 (the only exception being tibia length vs. tibia distal width). Moreover, the length:width relationship for each bone in more than 90% of the 100 000 re-samples does include 1 in its 95% interval. This implies than there is a strong regularity among the data, and that the results do not depend on specific specimens. The only exception is the astragalus, that shows greater variability.
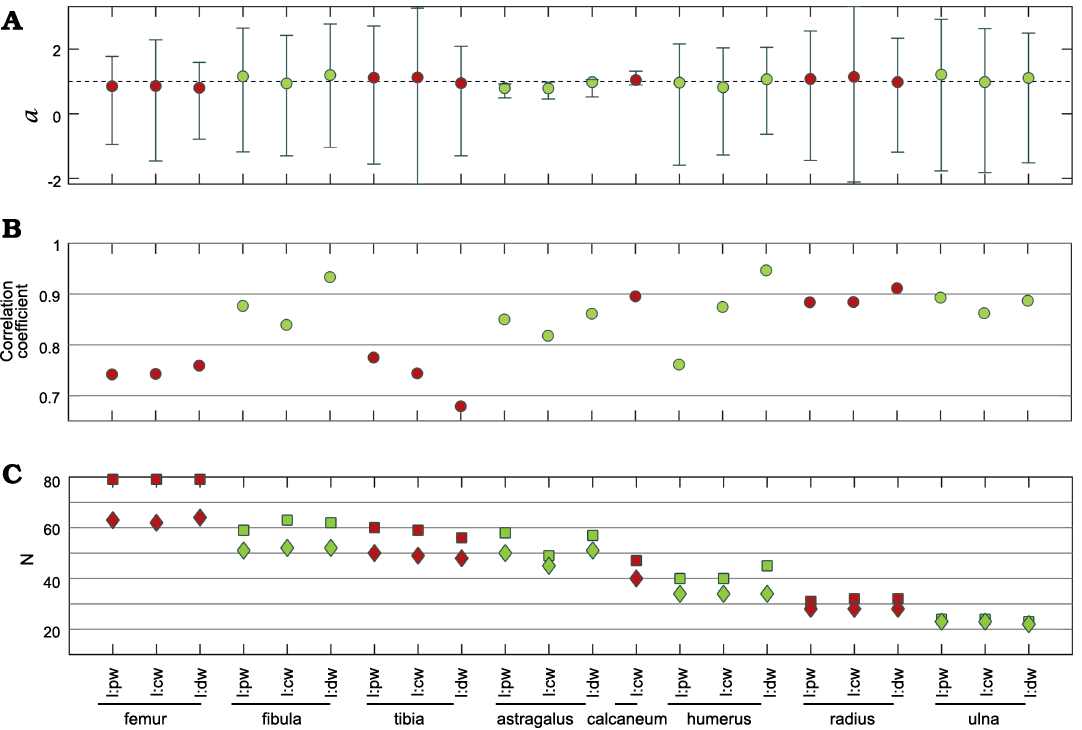
Fig. 4. Resultant parameters from the comparison between length and width of different limb bones of Mesosaurus tenuidens Gervais, 1865. Coefficient a and its 95% confidence interval (A), correlation coefficient (B), number of measurements/samples (squares) and number of individuals (diamonds) studied (C); colors identify measurements of the same bone. Abbreviations: cw, central width; dw, distal width; l, length; pw, proximal width.
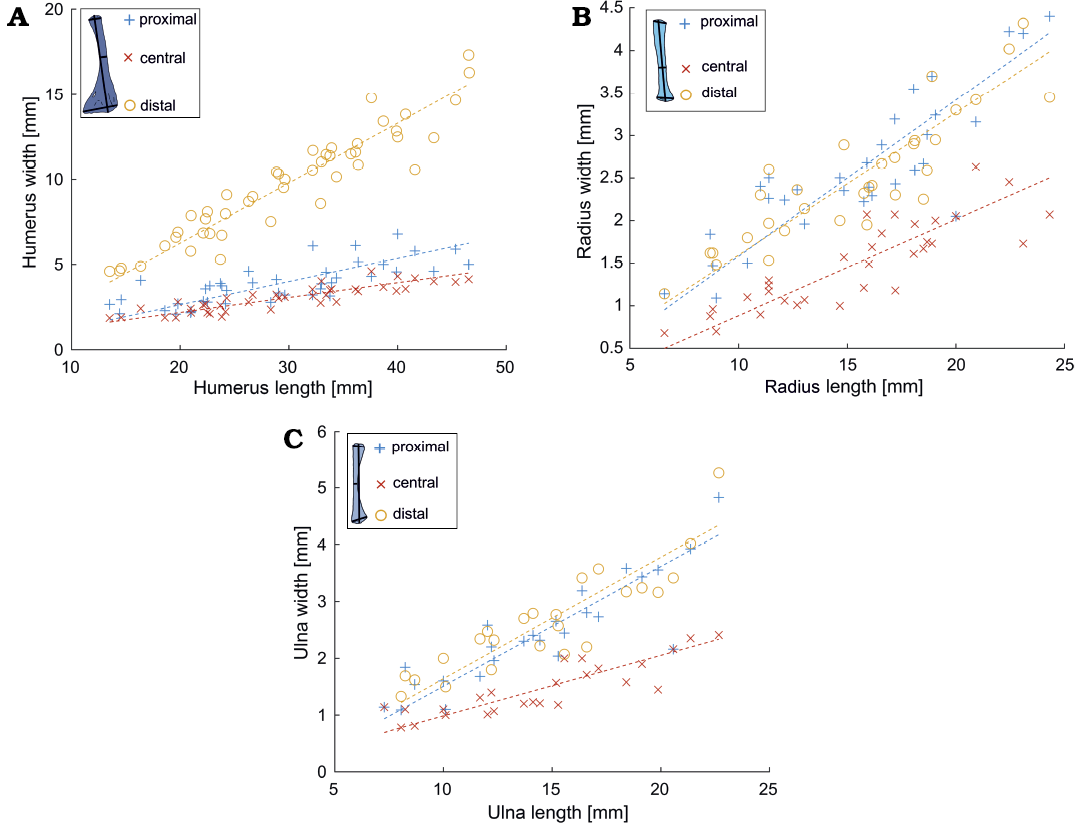
Fig. 5. Length vs. width relationships in different forelimb bones bones (A, humerus; B, radius; C, ulna) of Mesosaurus tenuidens Gervais, 1865. The measured bone and the measurements taken are indicated in the upper left corner of each figure (see Fig. 1). The statistical parameters are indicated in Fig. 4.
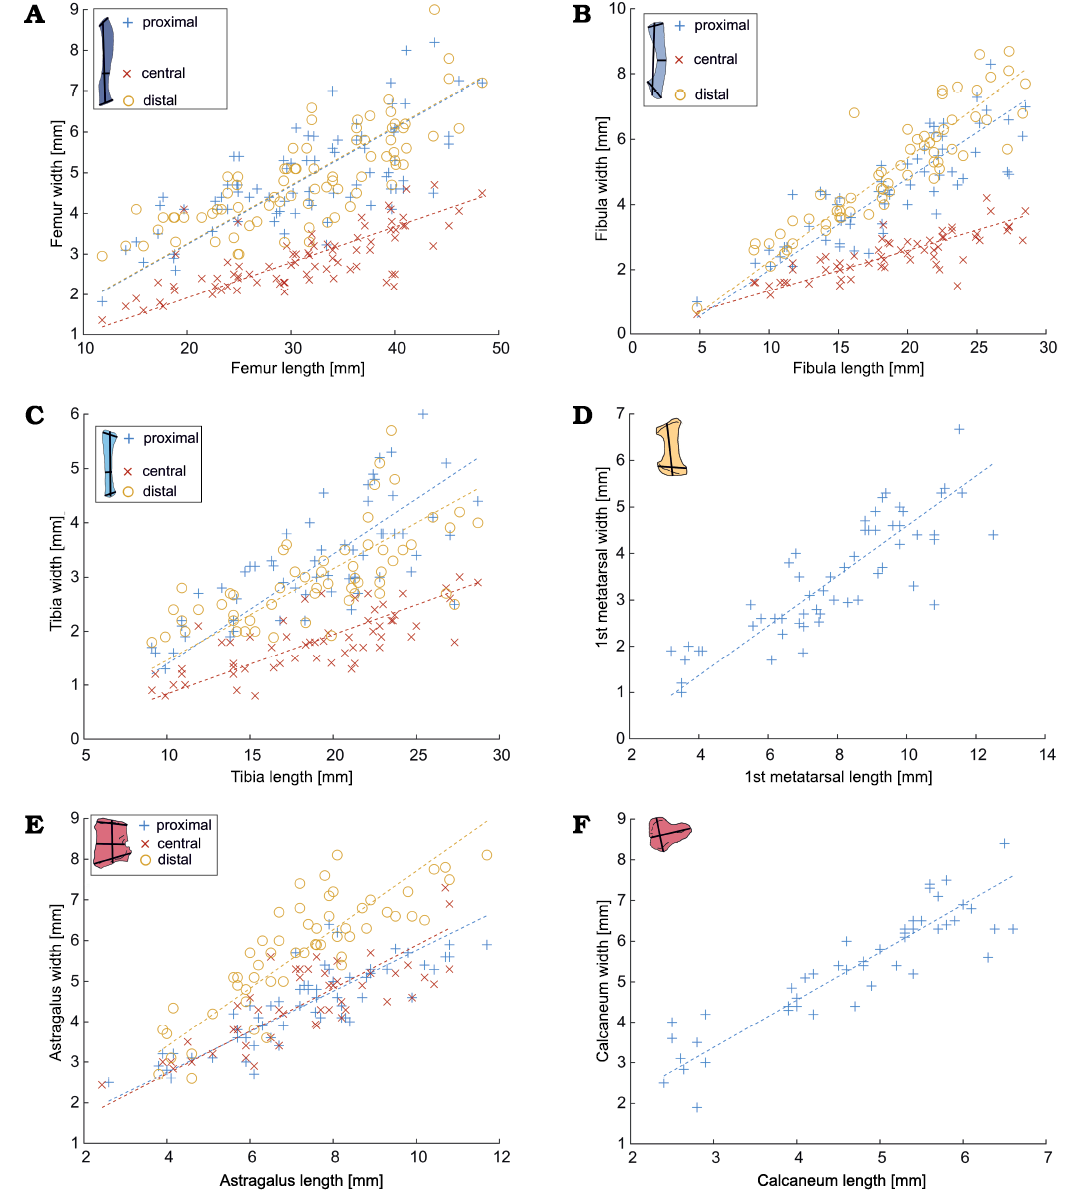
Fig. 6. Length vs. width relationships in different hindlimb bones bones (A, femur; B, fibula; C, tibia; D, metatarsal; E, astragalus; F, calcaneum) of Mesosaurus tenuidens Gervais, 1865. The measured bone and the measurements taken are indicated in the upper left corner of each figure (see Fig. 1). Statistical parameters are indicated in Fig. 4.
The relationship between the length of different bones in Mesosaurus tenuidens has also a high correlation (> 0.8), with values of the coefficient very close to 1 and their 95% confidence intervals including 1. That implies that there is a strong isometry in mesosaurs between all these structural elements.
Figure 7 summarizes all the statistical intra-bone relationships (slope a, correlation, and number of samples) of the measured bones, calculated using logarithmic data (Equation 2). Resampling corroborates and reinforces these results (SOM: table 2). All the mean slopes in the analysis are close to 1 with the confidence interval including 1, which indicates isometry. Most of the measurements show great homogeneity, since most of the resamples (more than 90%) resulted in isometry. Some measurements also show some variability, such as the femur:tibia, femur:fibula, humerus:ulna, humerus:radius and humerus:metacarpals III–V ratios. This may indicate more intraspecific variability, or greater variation due to taphonomy in these elements. In particular, it should be noted that there are comparatively fewer measurements in the forelimbs, because the preservation of these elements in good condition is rarer.
The linear relationship between the length of the measured mesosaur humeri vs. metacarpals is shown in Fig. 8A and femora vs. metatarsals in Fig. 8B. The relation of the length of the femur vs. humerus (Fig. 8C) and humerus vs. ulna and fibula (Fig. 8D) were also calculated. In all these cases, an isometric relationship can be observed (see also Fig. 7). The length of the tibia and fibula was also compared against the length of the femur (Fig. 9). In general, information coming from the forelimbs is less available than that of the hindlimbs; often due to taphonomic biases in which the forelimbs tend to be preserved under the body. However, despite metacarpal data are notoriously scarcer than those from metatarsals (Fig. 8A, B), an isometric relationship can be observed.
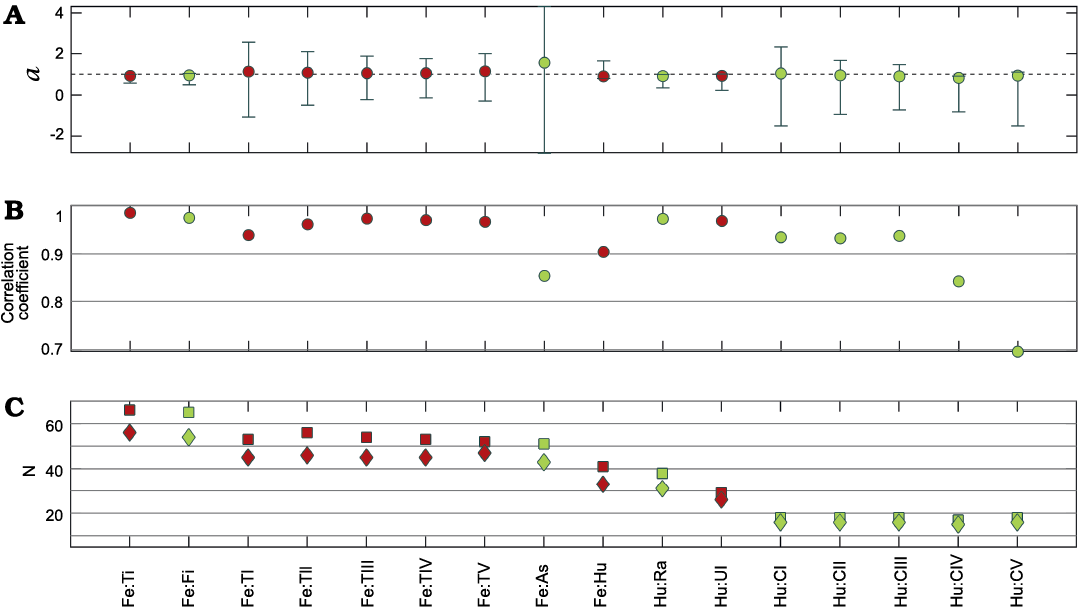
Fig. 7. Resultant parameters from comparison between the length of different limb bones of Mesosaurus tenuidens Gervais, 1865. Coefficient a and its 95% confidence interval (A), correlation coefficient (B), number of measurements/samples (squares) and number of individuals (diamonds) studied (C); colors identify measurements of the same bone. Abbreviations: As, astragalus; CI–CV, metacarpals, Fe, femur; Fi, fibula; Hu, humerus; Ra, radius; Ti, tibia; TI–TV, metatarsals; Ul, ulna.
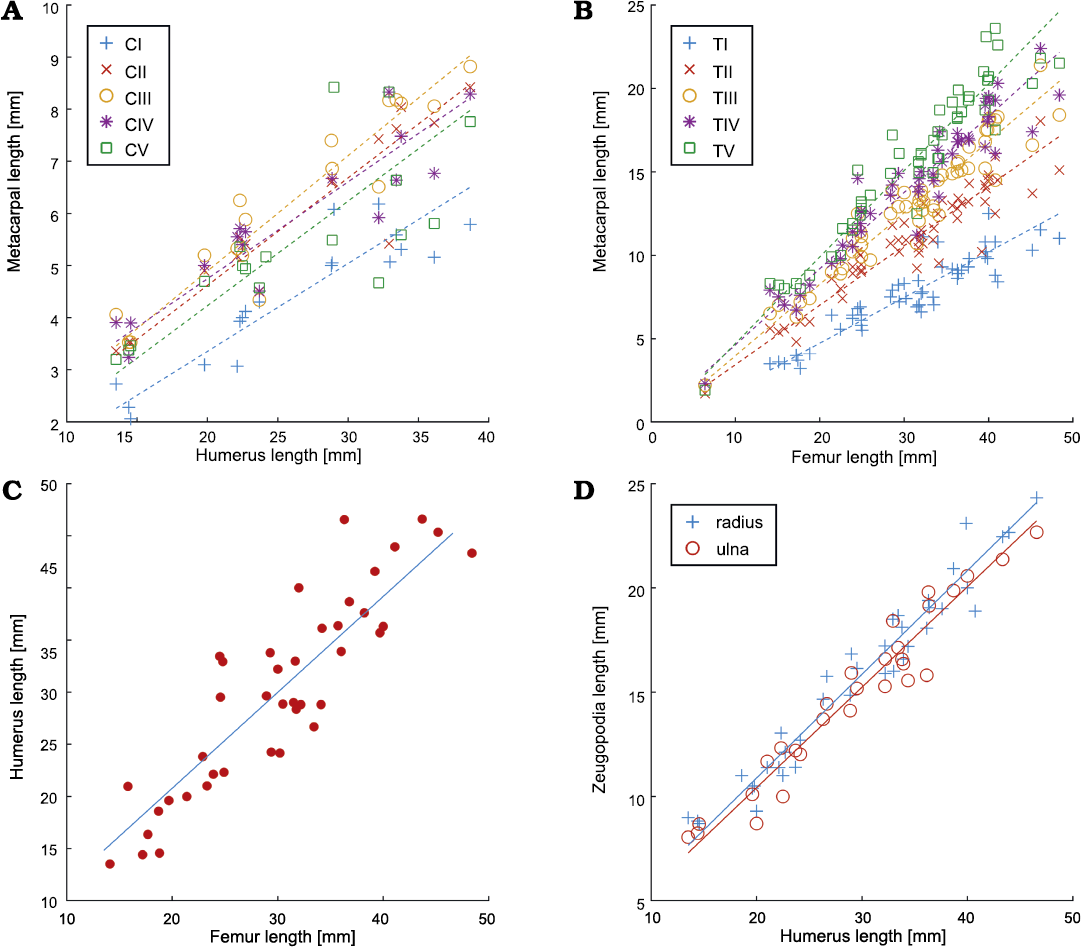
Fig. 8. Relationship between the lengths of different forelimb and hindlimb bones (A, metacarpal vs. humerus; B, metacarpal vs. femur; C, humerus vs. femur; D, zeugopodia vs. humerus) of Mesosaurus tenuidens Gervais, 1865. The respective statistical parameters are provided in Fig. 7. Abbreviations: CI–CV, metacarpals; TI–TV, metatarsals.
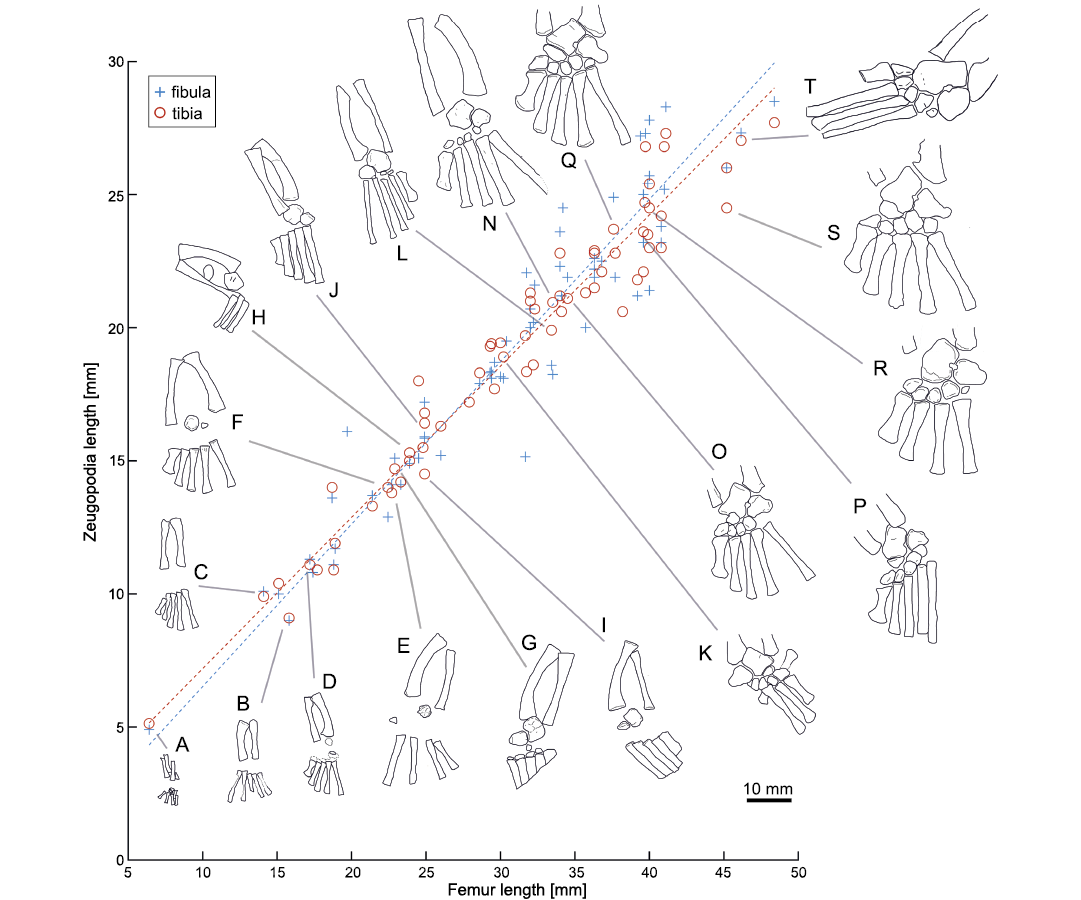
Fig. 9. Lengths of femora vs. zeugopodia in Mesosaurus tenuidens Gervais, 1865. Statistical parameters are shown in Fig. 7. Drawings (A–T) represent stages in the tarsal ontogeny of embryonic to adult mesosaurs following Piñeiro et al. (2016), see also Fig. 12. A, FC-DPV 2504; B, AMNH 23799; C, SMF-R4513-young; D, GP-2E 272; E, AMNH 23795; F, SMF-R 4496; G, SMF-R 4513-older; H, SMF-R 4934; I, MN 4741; J, PIMUZ A-III 591; K, GP-2E 114; L, GP/2E 6519-E; N, GP/2E 6519-A; O, SMF-R 4470; P, SMF-R 4528; Q; GP-2E 657b; R, FC-DPV 2058; S, GP-2E 5740; T, SMF-R 4477. Specimens A, D–I, K, M, O–S were previously analysed by Piñeiro et al. (2016).
In mesosaurs, the radius and the ulna are, on average, the same length. The same occurs with the tibia and the fibula. Likewise, radius and ulna are slightly shorter than tibia and fibula. In general, zeugopodium length tends to be 60% of the stylopodium, maintaining a strong isometric correlation between them (Fig. 7). For comparison, in Hovasaurus boulei, the tibia tends to be from one to three millimetres longer than the fibula, while tibia and fibula lengths are on average 80% of the femur length, also maintaining a strong correlation between them. Moreover, in H. boulei the ulna and radius are on average 50–65% of the humerus length, following an allometric ontogenetic relationship (Currie 1981).
Hind limb proportions (e.g., hindlimb length excluding the autopodium) and the length of the pes have been found to be particularly useful in identifying species ecology as well as for species characterization (Núñez Demarco et al. 2018; Farlow 2018). Consequently, we analysed the relationship between stylopodium plus zeugopodium against metapodium (SOM: table 2). The relationship between femur plus tibia against metatarsal I (and metatarsal V) also shows strong isometry. However, the relationship between humerus plus radius against metacarpal I (and metacarpal V) presents negative allometry. This result would not be strange considering that it is similar to the pattern observed in extant species (Farlow 2018). However, it is not clear whether this pattern in mesosaurs is related to the small number of samples analysed or not. As will be seen later in section “Phalangeal relationships in Mesosaurus tenuidens and Hovasaurus boulei”, phalangeal lengths of mesosaurs are strongly correlated with the metapodia length, consequently, the relationships obtained with the metapodia will remain almost unchanged when considering the autopodia. Therefore, the evidence indicates that mesosaurs possess a strong isometry in their hindlimbs and isometry or some level of negative allometry in their forelimbs.
The relationship between mean vertebral length and skull size also follows a linear relationship (Fig. 10A, SOM: table 2). The correlation and parameter a and its 95% interval are 0.98±0.2, with a correlation coefficient of 0.91 (in logarithmic and in non-logarithmic scales). When comparing the skull length to the femur length (Fig. 10B, SOM: table 2), and the skull length with the stylopodium length (Fig. 10C, SOM: table 2), an isometric linear relationship is seen again. Moreover, previous studies have shown that skull length vs. neck length, and skull length vs. mean tooth length are also isometric among mesosaurs (Piñeiro et al. 2021).
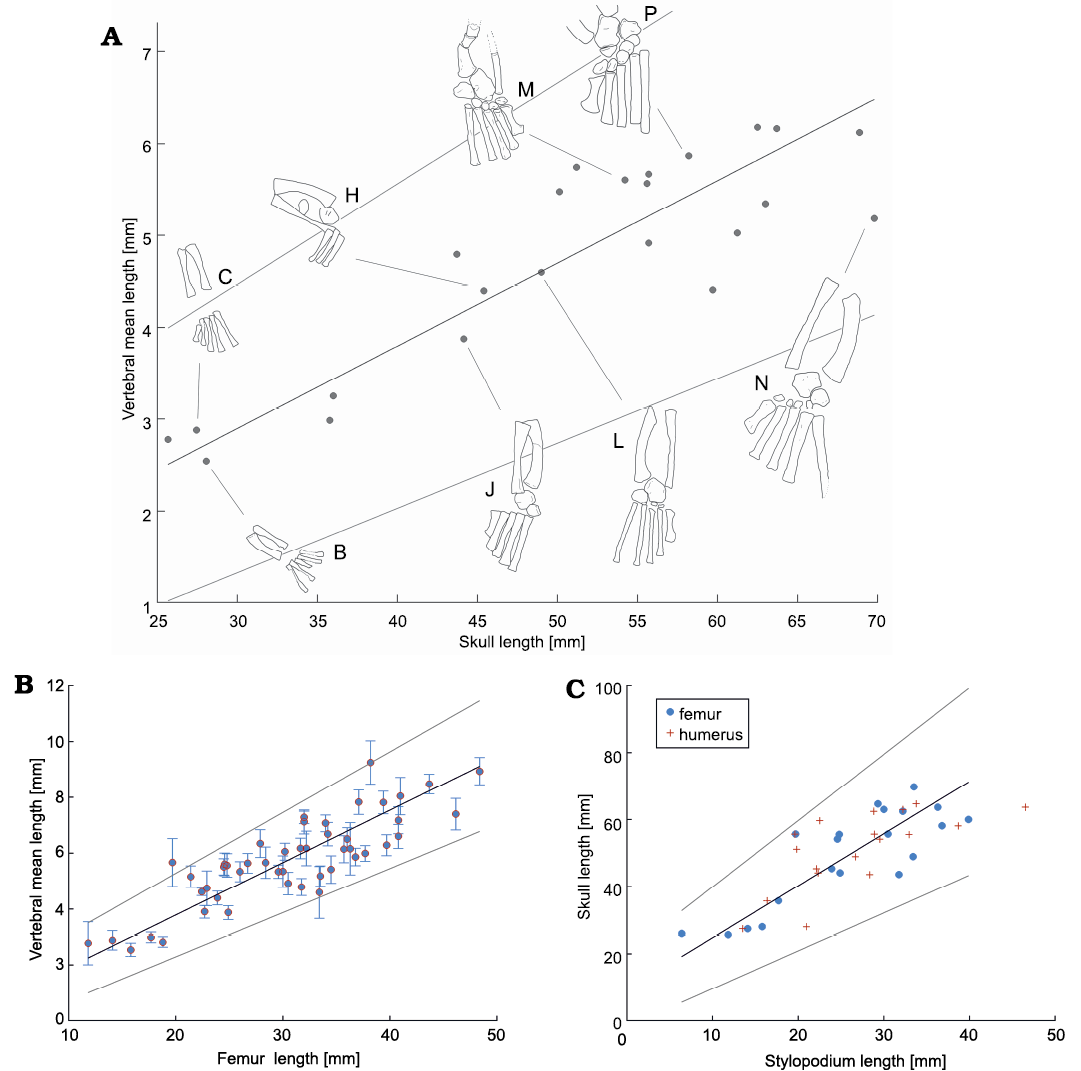
Fig. 10. Relationships between length of selected skeleton parts of Mesosaurus tenuidens Gervais, 1865. A. Relationships between vertebral mean length vs. skull length. Drawings (B, C, H, J, L, M, N, P) represent ontogenic stages of the specimens following Piñeiro et al. (2016); lettering consistent with Fig. 9, see also Fig. 12. B, AMNH 23799; C, SMF-R4513-young; H, SMF-R 4934; J, PIMUZ A-III 591; L, GP/2E 6519-E; M, PF IPL 220011/04 770; N, GP/2E 6519-A; P, SMF-R 4528. Specimens H, M, P were previously analysed by Piñeiro et al. (2016). 95% confidence interval is shown in each plot. B. Relationships between vertebral mean length vs. femur length with its 3σ interval. C. Relationships between skull length vs. stylopodium (zeugopodial) length.
The Mesosaurus tenuidens carpus
Interpretation of the anatomical construction of the bones in the mesosaur manus is a collateral result of this research. Historically, the carpus structure has been subjected to very different interpretations. For instance, Gervais (1865) described the presence of only two bones in the proximal series of Mesosaurus tenuidens, assuming that there is a small radiale and a large cubitale (ulnare). The pisiform was thought to be absent in the type specimen described by Gervais (1865), and only four distal carpals were suggested to be preserved.
Two proximal carpal elements without perforation between them were also described by Huene (1941) for M. tenuidens, identifying such elements as the ulnare and the intermedium. Moreover, Huene (1941) also described four distal tarsals for M. tenuidens the first one being the largest. The same anatomical arrangement was proposed by Kuhn (1969), but according to this author, the perforating foramen between the bones was present.
According to Seeley (1892), the carpus in mesosaurs is instead distinguished by the presence of three bones in the proximal series and four small elements in the distal line. Curiously, the intermedium is identified as the lunar by Seeley (1892) and the ulnare and the lateral centrale as the cuneiform and scaphoid (or centrale), respectively. However, Seeley (1892) argued that there is no definitive evidence to identify a scaphoid in the mesosaur manus, but he suggested that the structure of the mesosaur carpus is reminiscent of that present in the mammalian type if the scaphoid and the pisiforme are unossified in the radiale and ulnare positions, respectively. Seeley (1892) also emphasized that the four bones in the distal line are anatomically equivalent to the trapezium, trapezoid, magnum and unciform, the first being the smallest and the fourth the largest.
MacGregor (1908) stated that close to the intermedium there is an ossified radiale in M. tenuidens, which is the largest element in the proximal series. However, he surely misidentified this large bone, which may have been the first distal carpal. The ulnare is also present and delimits a small passage for a blood vessel along with the intermedium. Four tarsal bones comprise the distal series, and the first one is the largest. More recently, Modesto (1996, 1999, 2010) suggested that there could be a different structure in the carpus of M. tenuidens Gervais, 1865, and “Stereosternum tumidum” Cope, 1885. According to Modesto (1996, 1999, 2010) the carpus is formed by nine ossified elements in the latter taxon, the intermedium, the ulnare, and the lateral centrale in the proximal series and a spindle-shaped perforating foramen is present between the first two; five carpals comprise the distal series. The radiale remains unossified and the medial centrale could have been also unossified or it is absent. Modesto (1996, 2010) stated that a small pisiforme characterizes the carpus of “S. tumidum”, as he did not find this bone in M. tenuidens. Moreover, M. tenuidens would also be differentiated from “S. tumidum” by fusion of the intermedium and the lateral centrale; thus, just two bones occur in the proximal carpal series (intermedium+ulnare).
A recent study (Piñeiro et al. 2021) showed that “S. tumidum” is a junior synonym of M. tenuidens, and thus the differences found by Modesto (1996, 1999, 2010) are taphonomic or possibly influenced by the ontogenetic stage of the specimens that he analyzed. Moreover, other studies (e.g., Rossmann 2000) found no differences between the M. tenuidens and “S. tumidum” carpus, as they both possess two proximal bones and five elements in the distal series, but doubts remain if a lateral central is present in the latter. However, according to Rossmann (2000), “Brazilosaurus sanpauloensis” Shikama and Ozaki, 1966, would have had a different carpal structure consisting of three proximal elements and only four distal tarsal bones.
On the other hand, “B. sanpauloensis” was recently found to be also a junior synonym of M. tenuidens (Piñeiro et al. 2021) and the specimen that was considered the holotype for this species was reinterpreted as a subadult or young adult individual based on the poor development of the three featureless bones in the proximal series of the carpus and by the presence of only four distal carpals (see also Piñeiro et al. 2016).
It is important to note that the mesosaur manus is only well-preserved in a few of the analyzed specimens. In this study, which considers juvenile and adult individuals of M. tenuidens to comprise the only valid mesosaur species, we suggest that an ulnare and an intermedium are well ossified and always present bones in the proximal line of the mesosaur carpus, and an irregularly or well-shaped perforating foramen for blood vessel passage, is present between them in adults or subadults (Figs. 1B, 11, 12). A third large bone occupying a more medial position in the proximal carpal series is thought to be the lateral centrale, which probably includes also the medial centrale fused very early in the development. We have an evidence supporting this last hypothesis in one immature individual which shows a probable medial centrale close to the lateral centrale (Fig. 11B). The radiale is identified as an isolated small bone positioned medial to the lateral centrale in just a few specimens that were preserved in early stages of development (Figs. 11B, 12C, D). We have enough evidence to hypothesize that the radiale fuses to the lateral centrale, because it appears isolated close to this last bone and approaches to it, until becoming fused (Fig. 12C, D). However, is worth noting that the radiale is not observed in very young specimens, and it is rarely preserved in its original anatomical position in adult individuals.
Four or five bones can be seen in the distal carpal series of subadult and adult individuals, a feature also observed for the tarsus in previous studies (e.g., Piñeiro et al. 2016, 2021). There is also considerable variability in the degree of ossification and size of each of these distal carpal bones, although the fifth, when ossified, can be the smallest of the series in adult specimens, and the first or the fourth are the largest. Such a size pattern for the first and fourth distal carpals could simply be individual variability, taking into account that the fourth can be large in one manus and normally small in the other (Fig. 11D). Even though, the largest bone in the distal carpal series of synapsids and basal sauropsids is commonly the fourth one and the fifth is the smallest.
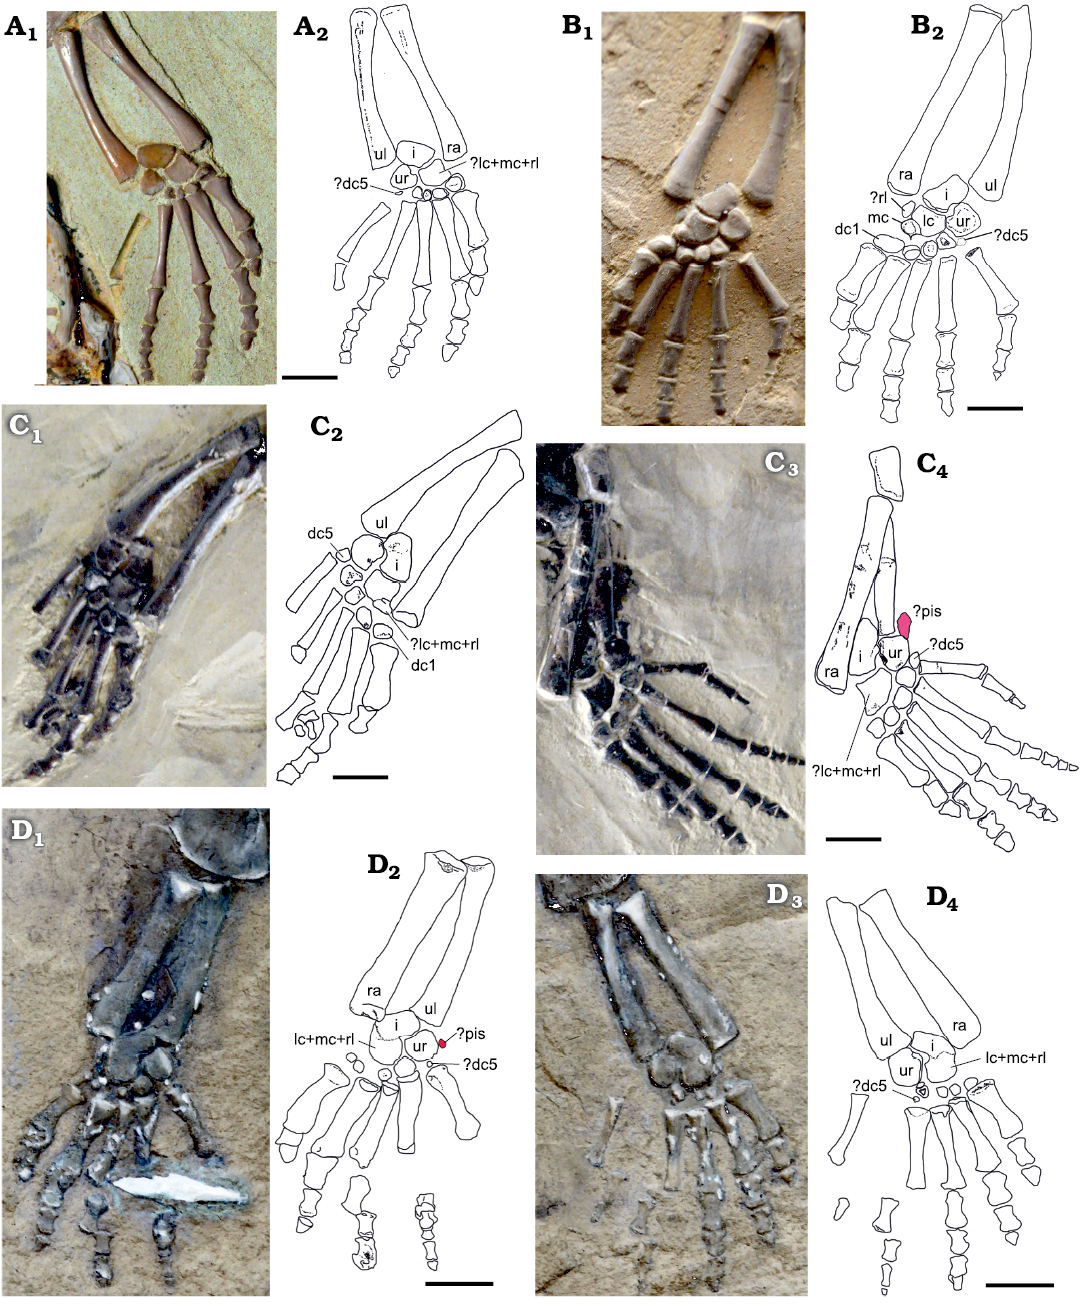
Fig. 11. Structure of the carpus of Mesosaurus tenuidens Gervais, 1865, in presumed subadult and adult specimens from Iratí Formation, Paraná, Brazil, ?lower Permian (A–C) and Griquas region of southern Africa, ?lower Permian (D). A, B. Manus of sub-adult SMF-R 4492 (A) and young adult SMF-R 4528 (B). In B five bones can be seen in the proximal carpal series, including a small ossified radiale close to the lateral centrale. Four bones (and perhaps an incipiently ossified very small dc5) are preserved in the distal series. C. Manus of SMF-R 4710, right (C1, C2) and left (C3, C4), a more mature specimen, which has only three bones in the proximal series, after the fusion of radiale, lateral centrale, and probably the medial centrale. There are five bones in the distal series, but the fifth continue to be the smallest. A small pisiforme can be seen in C3. D. Manus of MNHN AC 1865-77A, left (D1, D2) and right (D3, D4), the type specimen, a mature mesosaur showing the incipient fusion of intermedium and centralia plus radiale complex. A pisiforme and dc5 could have been present but were lost or are not well-preserved. Photographs (A1, B1, C1, C3, D1, D3) and interpretive drawings (A2, B2, C2, C4, D2, D4). Abbreviations: dc1, dc5, distal carpals I, V; i, intermedium; lc, lateral centrale; mc, medial centrale; pis, pisiform; ra, radius; rl, radiale, ul, ulna; ur, ulnare. Scale bars 5 mm.
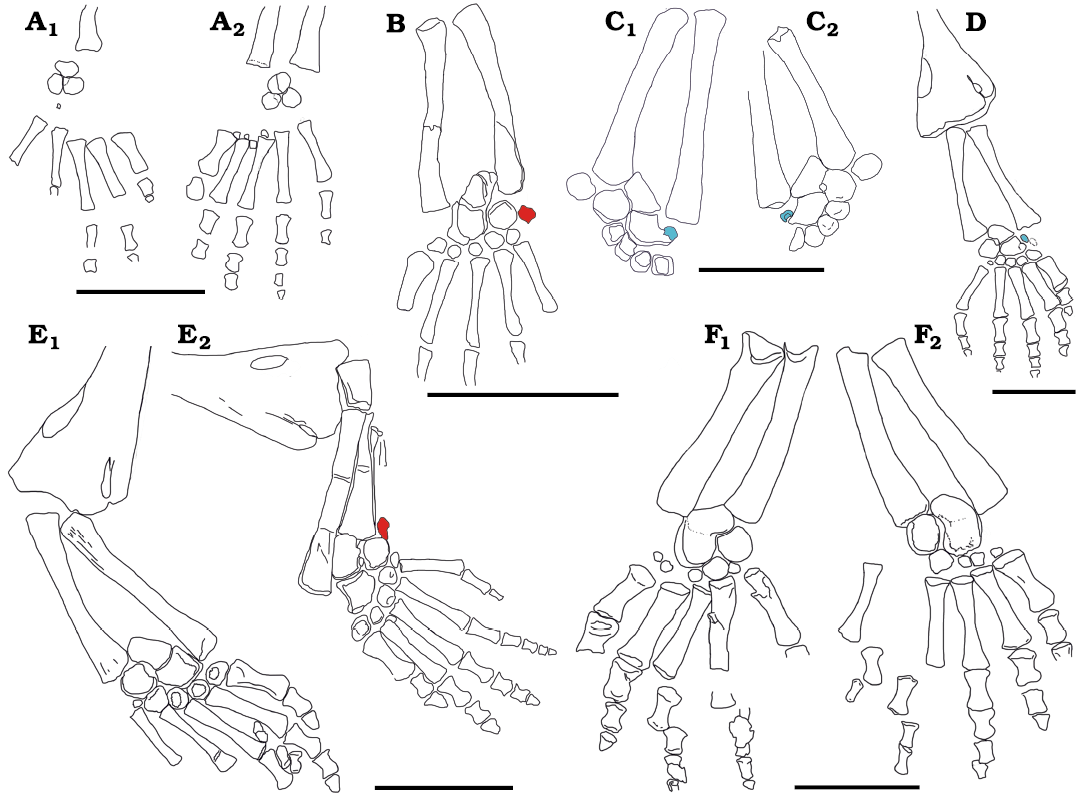
Fig. 12. Interpretive drawings showing variation of the carpus structure through the growth of Mesosaurus tenuidens Gervais, 1865. A. SMF-R 4485, left (A1) and right (A2) manus of a very immature individual, where just three rounded, featureless bones (intermedium, ulnare, and possible lateral centrale) are present in the carpus. B. MN 7148 showing a more mature carpus and a small possible pisiforme (in red) present close to the ulnare carpal bone. C. MCN-PV 2238A, part (C1) and MCN-PV 2238B, counterpart (C2) of left manus showing the radiale (in blue) close to completing its fusion to the centralia. D. SMF-R 4528, specimen showing the most common carpus structure found in the available materials, where the intermedium and the centralia complex place closer together to finally fuse each other. A small radiale is still present (in blue). E. SMF-R 4710, right (E1) and left (E2) manus of an adult mesosaur with the intermedium and the centralia plus radiale complex yet not fused. A small possible pisiform (in red) is present only in the right manus and absent from the left. F. MNHN AC 1865-77A, right (F1) and left (F2) manus of the type specimen, where an incipient fusion of the intermedium with the centralia plus radial complex can be observed. There seem to be five distal carpals although the fifth is indeed very small. Also, there can be a pisiforme, but the manus in this specimen have been exposed to partial degradation by the action of scavengers that damaged some of the smallest bones. Scale bars 10 mm.
Moreover, another very small element is present in the mesosaur carpus, although it is only rarely preserved along the other carpal bones. Regarding its position lateral to the ulnare, this small bone may be the pisiforme (Figs. 11C3, C4, D1, D2, 12B, E2), but as shown, it can be preserved in the right manus but absent in the left one of the same individual, or vice-versa. A small pisifome may also occur in the type specimen of Mesosaurus tenuidens (Fig. 11D) but partial degradation of the skeleton by the action of scavenger organisms such as pygocephalomorph crustaceans, could have removed some of the smallest bones. It has been suggested that the pisiforme is a sesamoid bone (see Fabrezi et al. 2007), and if so, its appearance or its absence (even in the manus of the same individual) could depend on taphonomic processes. For instance, some small elements positioned laterally to the lateral centrale are misidentified as the pisiforme (see Bickelmann and Tsuji 2018) but they are not preserved in the anatomical position of this bone. Thus, these small elements could be instead interpreted as sesamoid bones. We should note, though, that the pisiforme is so small that it can be easily lost or removed from its original position during the fossilization process, thus explaining why we have found this bone in just a few (fewer than five) of the studied specimens.
As can be seen from Table 1, the anatomical construction of the carpus has been differently interpreted by previous authors, denoting strong subjectivity in their conclusions that is related mostly to taphonomic artifacts, but that also depends on the grade of maturity of the studied individuals. Therefore, establishing the identity of the bones present in the carpus, as well as in the tarsus, will depend on the degree of ossification and fusion of the elements through the ontogeny. Even the fusion of the intermedium with the lateral centrale, suggested as a diagnostic character for M. tenuidens (e.g., Modesto 1996, 2010), is the last stage of the ontogenetic process that is characterized by the presence of only two bones in the proximal carpal series (intermedium and ulnare) (see Table 1).
Table 1. Historical review of the available literature where the structure of the mesosaur carpus was suggested. The three previously proposed mesosaur taxa are included to show that despite the disparity in the bone identification, there is a common pattern that depends on the degree of ossification and fusion of elements (i.e. ontogenetic stages). Small elements as the pisiforme and distal tarsal V can be lost.
| |
Mesosaurus
|
“Stereosternum |
“Brazilosaurus sanpauloensis” |
References |
|
Intermedium |
present |
present |
present |
Huene 1941; Kuhn 1969; Seeley 1892; |
|
present |
this paper |
|||
|
Radiale |
present or unossified |
unossified |
unossified |
Gervais 1865; Mac Gregor 1908; Modesto 1996; this paper |
|
present, unossified or fused to centrale |
this paper |
|||
|
Ulnare |
present |
present |
present |
Huene 1941; Kuhn 1969; Seeley 1892; |
|
present |
this paper |
|||
|
Centrale |
present |
present |
present |
|
|
present |
this paper |
|||
|
Medial centrale |
‒ |
present, unossified or absent |
– |
|
|
probably present and fused with central |
this paper |
|||
|
Pisiform |
– |
present |
?present |
|
|
present |
this paper |
|||
|
Number of distal carpals |
4 |
‒ |
‒ |
Gervais 1865;
Huene 1941; Kuhn 1941; |
|
5 |
5 |
4 |
||
|
5 (fifth ossify later) |
this paper |
|||
|
Largest distal carpals |
first, first, fourth, first, first |
‒ |
– |
Huene 1941; Kuhn 1969; Seeley 1892; |
|
variable |
this paper |
|||
On the other hand, condensation and ossification of the fifth distal carpal and distal tarsal bones may be independent of the process of condensation and ossification of the digital arch (Shubin and Alberch 1986), and so the differentiation of this toe can be achieved indistinctly earlier or later in the ontogeny.
Therefore, based on the new evidence, we can summarize the structure of the mesosaur proximal carpus as being formed by three or four bones in the juvenile stage (intermedium, ulnare and radiale plus fused medial and lateral centralia), and only two in adults, the intermedium (fused to the lateral centrale+radiale+?medial centrale complex) and the ulnare. Concerning the distal series, there can be four or five bones as also occurs in the tarsus, the fifth being the last one to ossify. As a result, the fifth distal carpal or tarsal is always the smallest of the series.
Mesosaur tarsus and ontogenesis
Ossification of the tarsal elements also correlates with the ontogenetic stage of the individuals (Piñeiro et al. 2016). Figure 13 displays the ontogenetic stage of several mesosaur specimens. Specimens in Fig. 13A, D–I, K, O–S (FC-DPV 2504, GP-2E 272, AMNH 23795, SMF-R 4496, SMF-R 4513-older, PIMUZ A-III 591, MN 4741, GP-2E 114, SMF-R 4470, SMF-R 4528, GP-2E 657b, FC-DPV 2058, GP-2E 5740) were previously analyzed by Piñeiro et al. (2016), whereas, specimens in Fig. 13B, C, H, J, L, M, N, T (SMF-R 4513-young, PIMUZ A-III 591, SMF-R 4934, PF IPL 220011/04 770, GP/2E 6519-E, GP/2E 6519-A, SMF-R 4477) are included in this work. In general, ontogenetic stages have a good correlation with size. Only specimens figured in Fig. 13G and L appear to be respectively more or less ossified than the surrounding specimens. Figures 9 and 10A show the tarsal elements of the studied specimens listed in Fig. 13.
Six groups (ontogenetic stages) can be clearly identified:
(i) The foetal stage being represented by only one individual with tarsal elements not yet ossified, and a femur length less than 10 mm (Figs. 9, 13A, see also Piñeiro et al. 2012a, 2016).
(ii) A second stage of young individuals with femur less than 22 mm long, which show no tarsal elements or an incipient ossification of the astragalus (e.g., Figs. 9, 13A–D). This group can include the previous one.
(iii) A third group characterized by individuals with femur lengths between 22 to 28 mm showing tarsal elements beginning to ossify, with barely ossified and rounded (featureless) astragalus and calcaneum and absence of distal tarsals (e.g., Figs. 9, 13E, F, H–J), or in a very incipient state of ossification (e.g., Figs. 9, 13G). The astragalus and calcaneum remain separated and the foramen for the perforating artery is not visible (see Piñeiro et al. 2016).
(iv) The fourth stage comprises mesosaurs with femora longer than 28 mm and shorter than ~40 mm, which have well ossified tarsal elements consisting of a square astragalus and triangular calcaneum, an incipient foramen for the perforating artery and a rounded and immature navicular (fused centralia 1 and 2). Note that this group has specimens with the astragalus well ossified and perfectly showing the distal border with centralia 1 and 2 not yet completely coossified (e.g., specimen Figs. 9, 13N). The first four distal tarsals can be either immature (e.g., Figs. 9, 13M, N) or well-developed (e.g., Figs. 9, 13K, O). Meanwhile the fifth distal tarsal appears to be absent.
(v) The fifth group is composed of mesosaurs with femora of ~40 mm long, characterized by well ossified tarsal elements, a conspicuous foramen for the perforating artery and a well-developed navicular (fused centralia 1 and 2) in an elongated form, but still not fused to the astragalus (e.g., Figs. 9, 13P, Q).
(vi) Finally, the sixth group, composed of mesosaurs with a femur length greater than ~40 mm long, where the tarsal elements such as the astragalus and navicular become fused (e.g., Figs. 9, 13R, S, T). The fifth distal tarsal is present either immature (Fig. 13R) or well developed (Fig. 13S).
While ossification of the astragalus, navicular and calcaneum appears to correlate well with size, ossification of the distal tarsals does not correlate so well. Indeed, distal tarsal ossification appears to be very variable (Piñeiro et al. 2021). For example, one specimen in the stage (Fig. 13G) (iii), includes four well-developed distal tarsals, and even a bone that appears to be an incipient navicular (fused centralia). Among mesosaurs with femur length between 23 and 40 mm, some specimens show incipient ossification of the distal tarsals (e.g., Fig. 13M, N) while others display an advanced degree of ossification (e.g., Fig. 13K, O). Moreover, among mesosaurs with femora greater than 40 mm, some specimens can have the fifth distal tarsal poorly developed (e.g., Fig. 13Q, R, T) whereas in others the fifth distal tarsal is instead well developed (e.g., Fig. 13P, S; see also Piñeiro et al. 2021). Therefore, the presence of the fifth distal tarsal appears to be characteristic of the most mature mesosaurs (e.g., Fig. 13P–T).
Figure 14 summarizes the six ontogenetic (tarsal) stages and its correlation with size, as well as tabulates the approximate dimensions of the various bones in those stages, supported by current observations. Based on the ontogenetic series and the lack of ossification of the carpal and tarsal elements, stages (i) to (iii) correspond to juvenile individuals, stage (iv) is presumed to characterize sub-adults, and the stages (v) and (vi) the “elder” adult phase (see also Piñeiro et al. 2016).
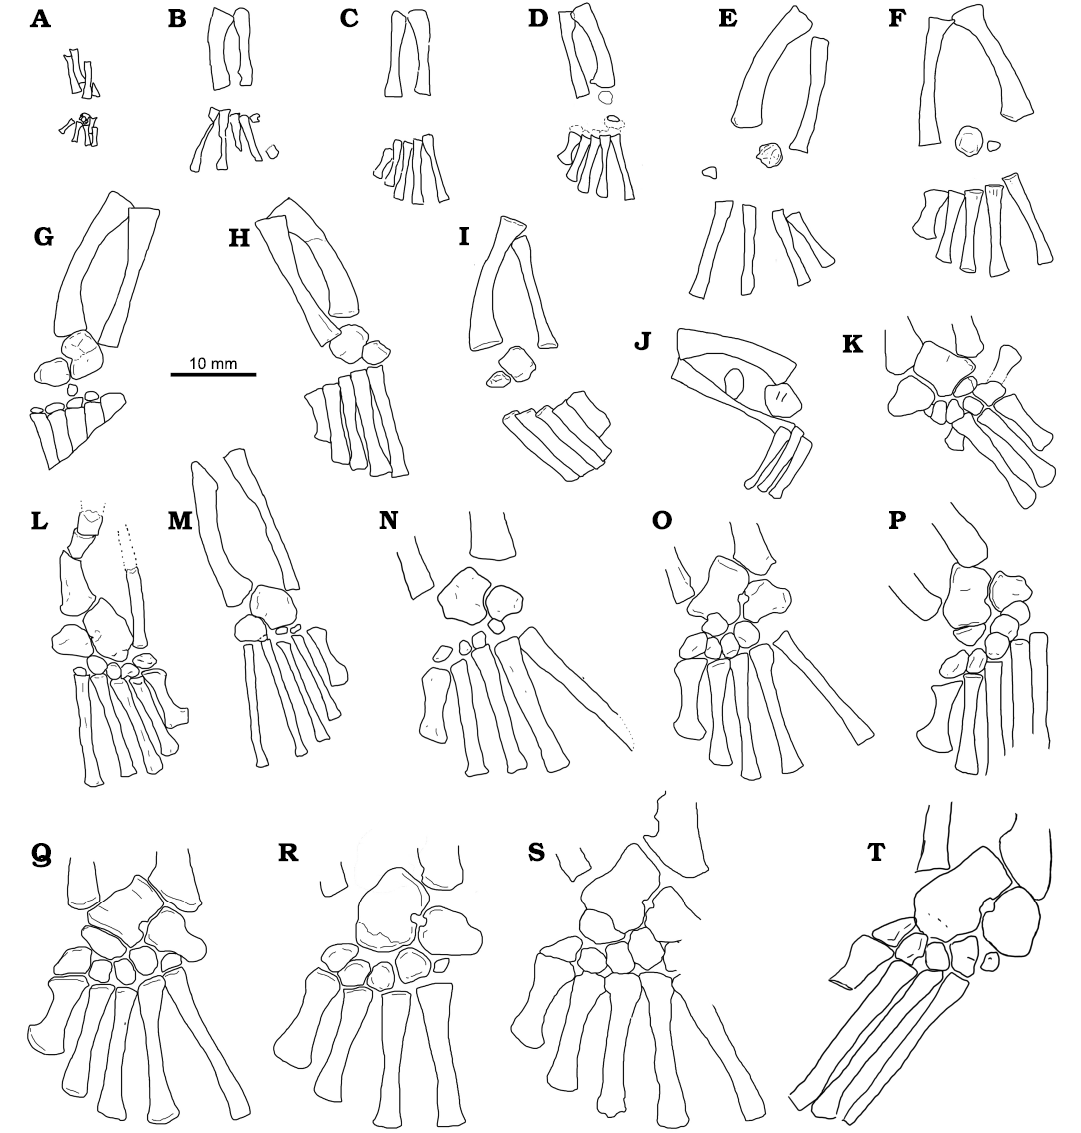
Fig. 13. Interpretive drawings of Mesosaurus tenuidens Gervais, 1865, showing ontogenetic transformation in the tarsus formation in specimens preserving epipodial, mesopodial, and metapodial elements (after Piñeiro et al. 2016). A. FC-DPV 2504. B. AMNH 23799. C. SMF-R 4513-young. D. GP-2E 272. E. AMNH 23795. F. SMF-R 4496. G. SMF-R 4513-older. H. PIMUZ A-III 591. I. MN 4741. J. SMF-R 4934. K. GP-2E 114. L. PF IPL 220011/04 770. M. GP/2E 6519-E. N. GP/2E 6519-A. O. SMF-R 4470. P. SMF-R 4528. Q. GP-2E 657b. R. FC-DPV 2058. S. GP-2E 5740. T. SMF-R 4477. Specimens A, D–I, K, M, O–S were previously analysed by Piñeiro et al. (2016).
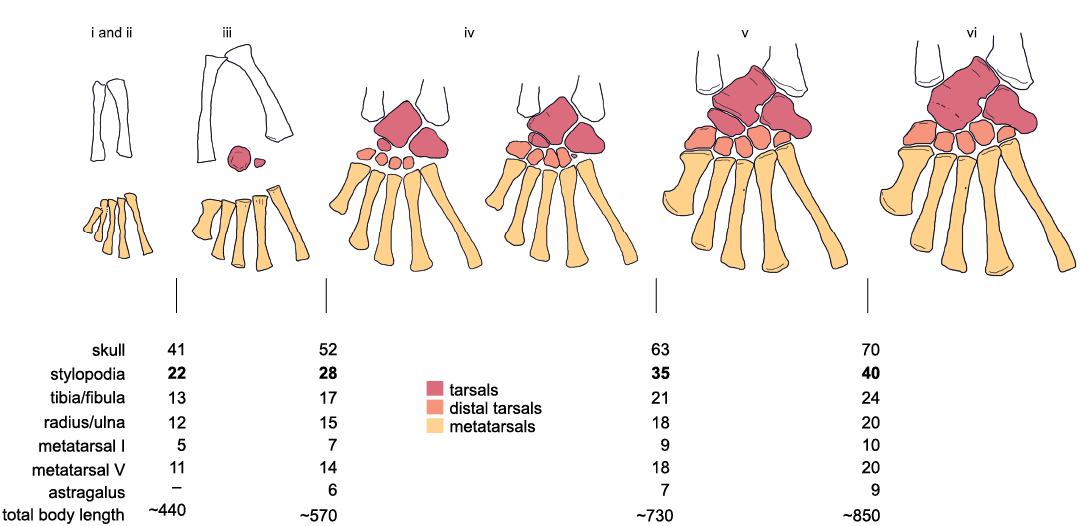
Fig. 14. Schematic diagram of the ontogenetic transformation of the tarsus in Mesosaurus tenuidens Gervais, 1865. Five stages (i–vi) are divided according to the ossification of the astragalus, calcaneum, and navicular. Distal tarsal morphology can display some variations regarding the degree of ossification of the constituent bones (see the text). The approximate sizes (in mm) that the different elements would have in the transition between each category are tabulated according to our observations.
Metapodial relationships in Mesosaurus tenuidens and Hovasaurus boulei
The relationship between metacarpals and metatarsals of each manus and pes in both Mesosaurus tenuidens and Hovasaurus boulei is addressed in Fig. 15. For each finger and toe we plotted metapodium length vs. the metapodium position, where each measured hand or foot is represented by a curve in the graph.
Curiously, mesosaur metacarpals have very varied patterns (Figs. 1, 15A). In most mesosaur specimens, the size of the metacarpals increases from the first to the second and then remains about the same size for metacarpal III and V, and metacarpal V being the longest. However, some mesosaurs show a maximum in the metacarpal III and a relative decrease in size in the metacarpal V, while an almost constant length in all metacarpals is seen in one specimen.
Hovasaurus boulei has a more regular pattern, with metacarpal III or IV being the longest, with lengths thus decreasing in size towards metacarpals I and V (Figs. 2, 15B).
In contrast, a characteristic mesosaur feature is that the metatarsals of each toe become successively longer from digit to digit, with the metatarsal I being the shortest and the metatarsal V the longest (Figs. 1, 15C). The metatarsal II is approximately 1.25 (1+1/4) times longer than the first, whereas the third is 1.5 (1+2/4) times longer, the fourth one is 1.75 (1+3/4) times longer and the fifth one is approximately 2 times longer than the metatarsal I. The empirical proportion followed for the mesosaur metatarsals is: mt(n) = mt(1) + n/4, where mt(1) is the measure of the metatarsal I and mt(n) is the measure of metatarsal n. In H. boulei (Figs. 2, 15D) the metatarsal II is 1.7 times longer than the first one, the metatarsal III is 2 times longer, the metatarsal IV is 2.1 times longer, but the metatarsal V is only 1.66 times longer than the metatarsal I.
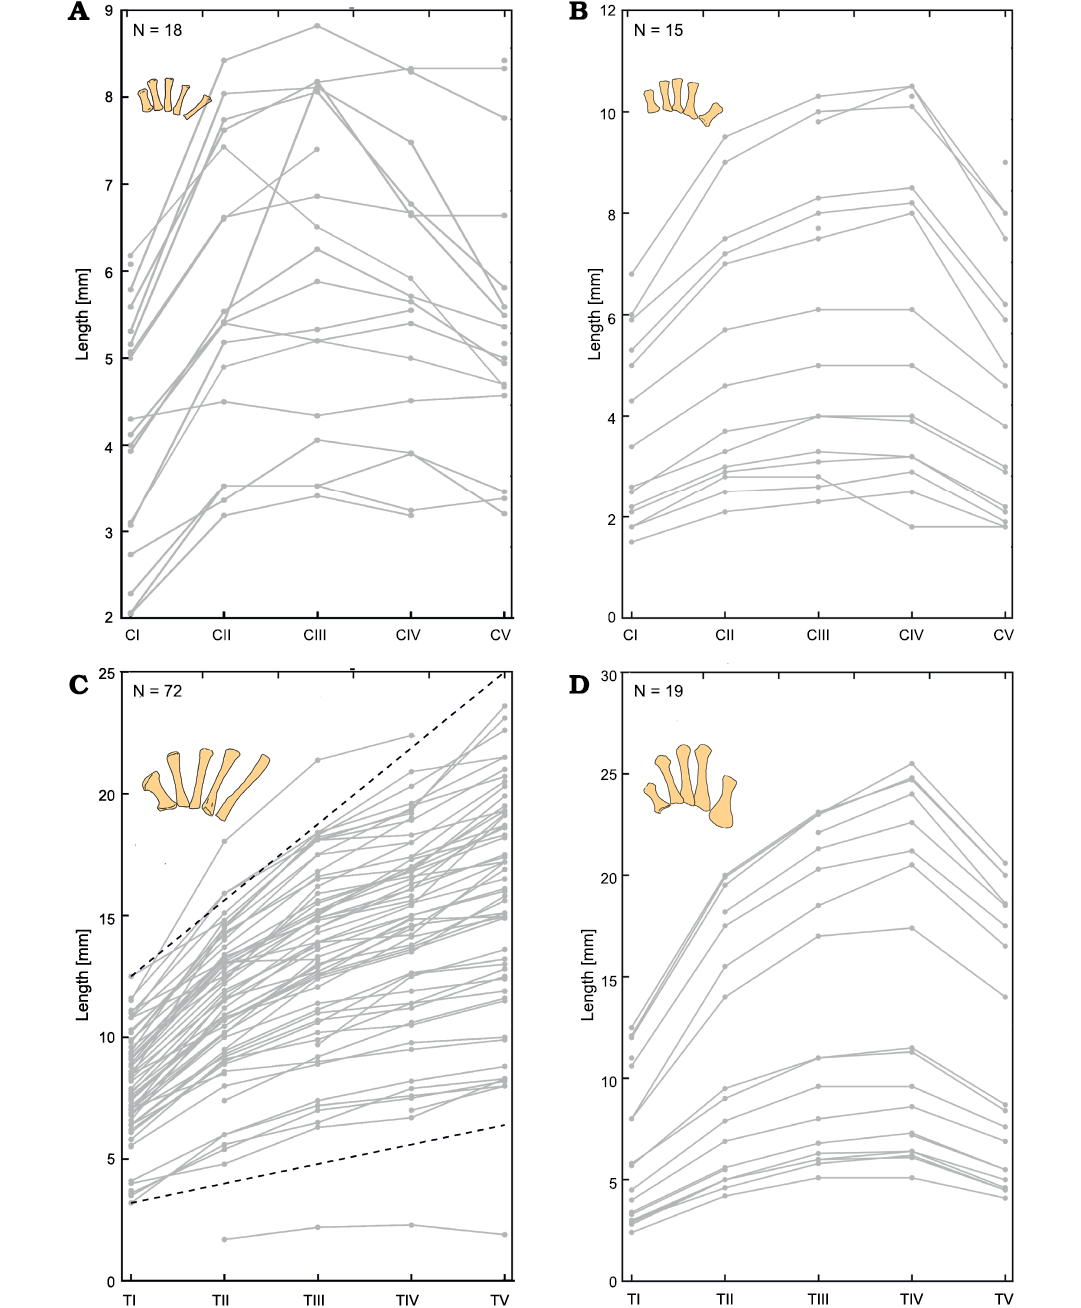
Fig. 15. Metacarpal length measured in each manus (A, B) and pes (C, D) of Mesosaurus tenuidens Gervais, 1865 (A, C) and Hovasaurus boulei Piveteau, 1926 (B, D). Each line represents the hand or foot of one specimen. Number of samples (N) is shown in each figure. Black dashed line represents the empirical proportions followed for the mesosaur metatarsals: mt(n) = mt(1) + n/4 where mt(1) is the measure of the metatarsal I. Metapodium is represented in the upper left corner of each figure (see Figs. 1, 2). Abbreviations: CI–CV, metacarpals; TI–TV, metatarsals.
Phalangeal relationships in Mesosaurus tenuidens and Hovasaurus boulei
The phalangeal formula of the manus and pes in Mesosaurus tenuidens is 2-3-4-5-3 and 2-3-4-5-5 (digit I–V, including the vestigial clawed tips), respectively (see Fig. 1). The claw of the fifth toe is only observable in three out of 78 specimens that preserve the phalanges. An unusual but diagnostic character of mesosaurs is that digit V is the longest of all, decreasing regularly to digit I (Fig. 1).
As in previous analyses, we examined the phalanx size variation within each finger and toe. For each finger/toe we plotted toe length vs. its phalangeal position, and each measured finger/toe is represented by a curve in the graph (Figs. 16–19). In mesosaurs, the phalanx length decreases successively from proximal to distal, following the same general constant relationship in each finger/toe. The relationship is empirically approximated as 1/(n+1) (or more precisely: 1/[1.2(n+1)]) meaning that, the length of the first phalanx (n = 1) is 1/2 of the respective metapodial length, the second phalanx is 1/3 of the metapodial length, the fourth phalanx is 1/4, and the fifth phalanx (including the clawed tip) is 1/5. Normalizing the results by the metapodium length allows comparison of all the fingers measured in 18 and toes measured in 43 different individuals, following the same general pattern (Figs. 16F, 18F). Although some minor variations over this pattern can be clearly observed, phalanx length differs less than 2 mm from the population mean or empirical values (Figs. 16F, 18F). It is worth noting that these phalanx–metapodium relationships do not change within the mesosaur population; thus, it is independent of size or age. This relationship persists on both feet and hands, and each of the five fingers/toes of each specimen follows the same pattern. Even considering that natural intraspecific variation or taphonomical distortion of the bones occur, such geometrical regularity is outstanding.
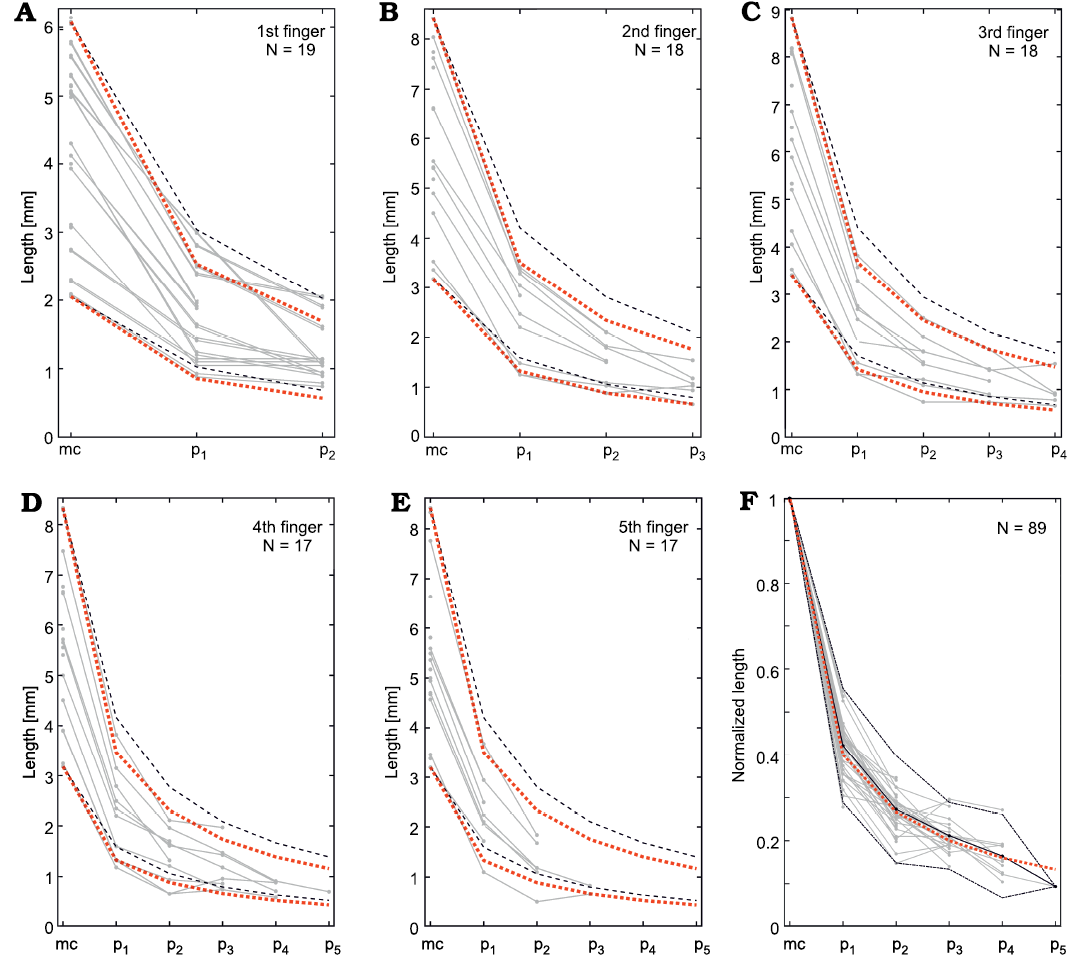
Fig. 16. Mesosaurus tenuidens Gervais, 1865, metacarpal and phalanx measurements. A–E. Metacarpal and phalanx lengths measured in each1st–5th finger. Black dashed lines represent the empirical curves pn = ct /(n+1) and red dotted lines represent the empirical curve px = ct /[(n+1)*1.2] for the largest and smallest measured finger, where ct is the length of the metacarpals and pn is the length of the n-th phalanx. F. Lengths are normalized by the respective metacarpal length in all the measured fingers. Black line shows the mean normalized length; black dash-dotted line represent the 2σ interval. Red dotted line represents the empirical curve pn = ct/[(n+1)*1.2]. The number of individuals measured (N) is indicated in the upper corner of each graph. Abbreviations: mc, metacarpals; p1–p5, phalanges.
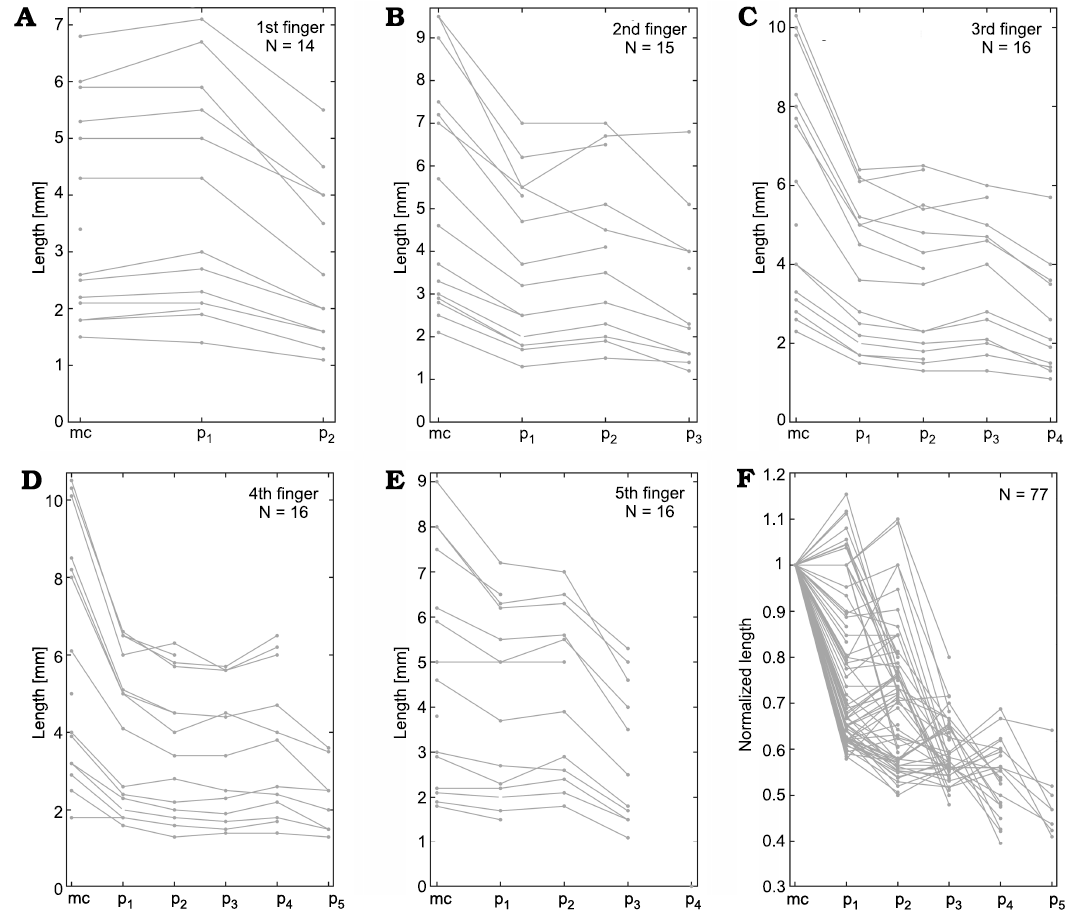
Fig. 17. Hovasaurus boulei Piveteau, 1926, metacarpal and phalanx measurements. A–E. Metacarpal and phalanx lengths measured in each 1st–5th finger. F. Lengths of all fingers normalized by the respective metacarpal length. The number of individuals measured (N) is indicated in the upper corner of each graph. Abbreviations: mc, metacarpals; p1–p5, phalanges.
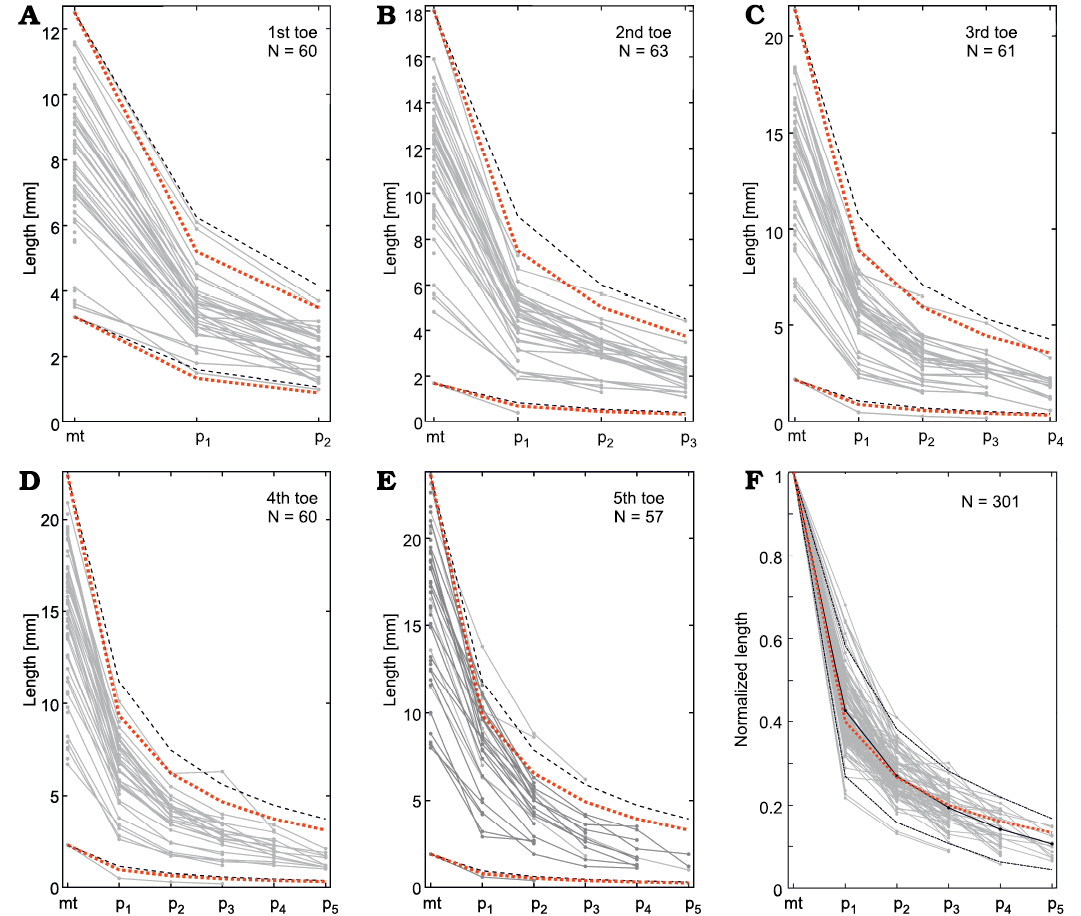
Fig. 18. Mesosaurus tenuidens Gervais, 1865, metatarsal and phalanx measurements. A–E. Metatarsal and phalanx lengths measured in each 1st–5th toe. Black dashed line represents the empirical curves pn = mt/(n+1) and red dotted lines represent the empirical curve pn = mt/[(n+1)*1.2] for the largest and smallest measured toe, where mt is the length of the metatarsal and pn is the length of the n-th phalanx. F. Lengths are normalized by the metatarsal length for all the measured toes. Black line shows the mean normalized length, black dash-dotted lines represent the 2σ interval. Red dotted line represents the empirical curve pn = mt/[(n+1)*1.2]. The number of individuals measured (N) is indicated in the upper corner of each graph. Abbreviations: mt, metatarsals; p1–p5, phalanges.
On the other hand, Hovasaurus boulei has a phalangeal formula of the manus as 2-3-4-5-4 and 2-3-4-5-4 for the pes (Currie 1981). The comparative analysis performed revealed that unlike M. tenuidens, H. boulei IV toe is the longest (Figs. 1, 2), as is usual in basal Permian tetrapods (Romer 1956). The variation found in the H. boulei phalanx size within each finger is plotted in Fig. 17 and that for each toe is plotted in Fig. 19.
Phalanx size of the H. boulei manus is plotted in Fig. 17. Digit I of the first phalanx is slightly longer than the respective metacarpal, while the second phalanx represents approximately 80% of the respective metacarpal (Fig. 17A). Digits II, III, and V have the first and second phalanx of approximately the same size (~60–70% of the metatarsal). In digits II and V, the third phalanx decreases again in length, whereas in digit III the third phalanx increases in length in most specimens (Fig. 17B, C). Digit IV has the first and fourth phalanx of approximately the same size, ~70% of the respective metacarpal, whereas the second and third phalanx also are about the same size but are shorter than the first and fourth (~60% of the metacarpal).
Regarding the pes, the plotted toe phalanges decrease successively in size (Fig. 19), although the H. boulei toes show three distinct patterns. Digits II, III, and V display a similar pattern (which cannot be given in a simple formula as in mesosaurs). The first phalanx is approximately 50% the length of the respective metatarsal, the second phalanx is ~40% the length of the metatarsal, the remaining phalanges are ~35%, ~30% and ~28% the length of their metatarsals, respectively. This produces a pattern that follows a concave up curve. However, digit V differs in that the first phalanx is 80% the size of the metatarsal and the remaining phalanges follow the proportions ~50%, ~45%, and ~30% (Fig. 19E). Furthermore, the digit I has different proportions; the first phalanx is ~90% the length of the respective metatarsal, whereas the second phalanx is ~60% of the metatarsal, following a somewhat concave pattern (Fig. 19A).
Both the manus and pes patterns in H. boulei reveal great variability. The phalanges not only decrease in size as in M. tenuidens, they also maintain the size of the previous phalanges or metapodium and even increase in size with respect to the previous one. Moreover, each finger/toe has a different pattern, particularly digits I and V. Even though the pattern of the hands and feet seems to be similar, they also show notable differences. This condition in H. boulei is in complete contrast to the strongly regular pattern observed in M. tenuidens.
From another point of view, Figs. 20 and 21 show respectively the available data for toes in M. tenuidens and H. boulei arranged in stacked bar diagrams and sorted by size. Unlike the previous diagrams that show the morphometric relationships, these diagrams allow better appreciation of the taphonomic state of the samples and the size distribution within the species. Most of the mesosaur specimens have their phalanges preserved (Fig. 20), the first toe being the best preserved and the fifth one the worst. Hovasaurus boulei, instead, has a more homogeneous preservation of toes (Fig. 21).
As previously shown, mesosaur bones follow an isometric relationship and size has a good correlation with ontogenesis (Fig. 9), therefore, the size sorting of the samples can be related to the ontogenetic growth pattern of the species. Whereas continuous growth is observed in mesosaurs, which does not appear to stagnate (Fig. 20), the length of the metatarsals in H. boulei seems stuck in larger individuals (Fig. 21), perhaps reflecting a limit of growth. Additionally, H. boulei has a good representation of the “juvenile” population (with metatarsals less than 10 mm) and of larger specimens that may represent the “adult” population (with metatarsals longer than 10 mm). In mesosaurs, a more continuous and gradual pattern is observed, although a slight jump can be seen after the leftmost individual in Fig. 20 (the unborn mesosaur specimen, FC-DPV 2504, Piñeiro et al. 2012a). This jump, also visible in the other metatarsals, indicates the lack of information in the transition between the foetal state and the youngest specimens recorded. This result is to be expected because according to information from extant reptile groups, the neonate stage is presumably short (see Figs. 13, 14).
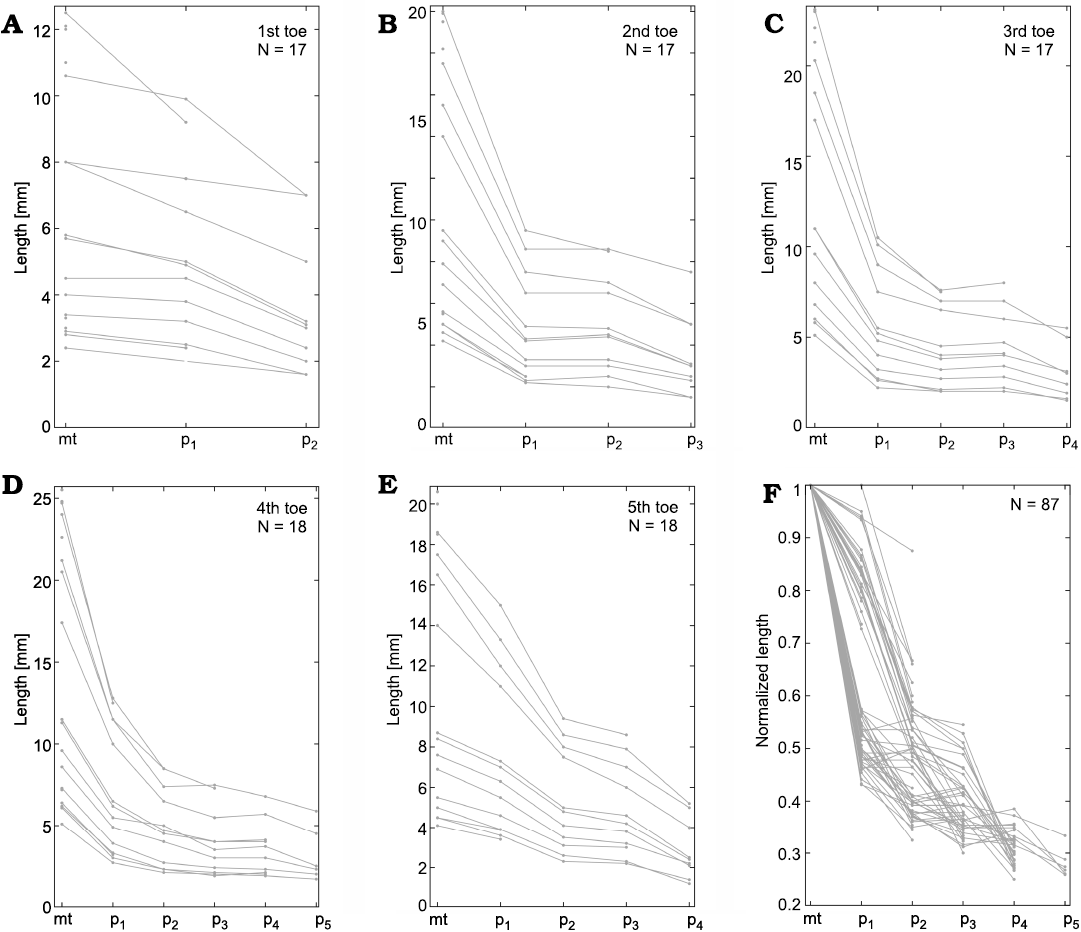
Fig. 19. Hovasaurus boulei Piveteau, 1926, metatarsal and phalanx measurements. A–E. Metatarsal and phalanx lengths measured in each 1st–5th toe. F. Length after being normalized by the metatarsal length for all the measured toes. The number of individuals measured (N) is indicated in the upper corner of each graph. Abbreviations: mt, metatarsals; p1–p5, phalanges.
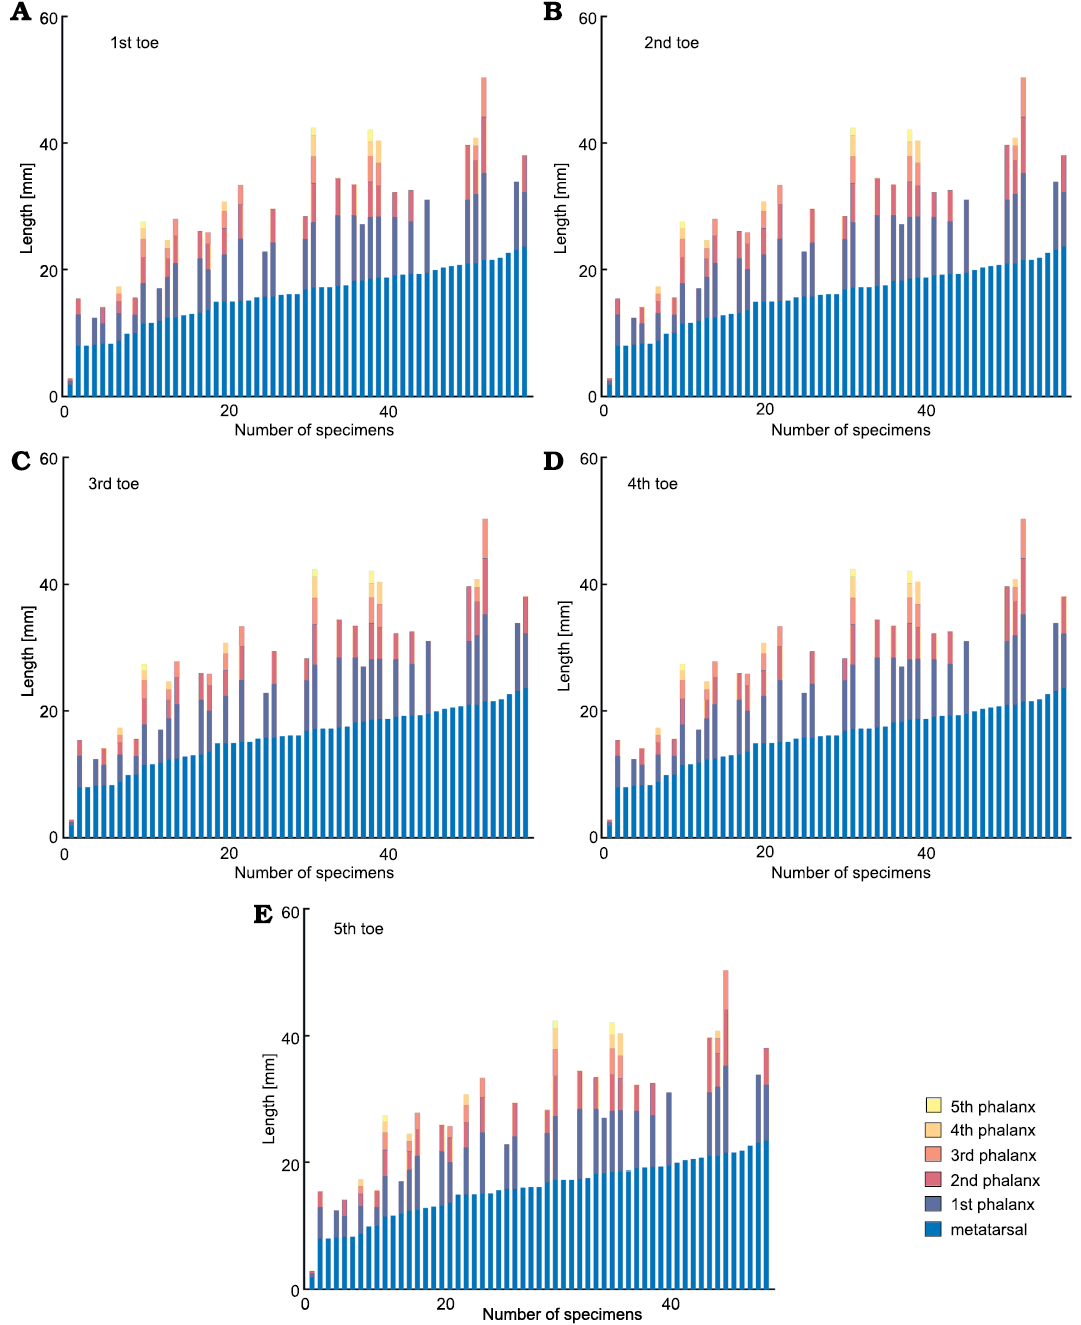
Fig. 20. A–E. Stacked bar diagram of Mesosaurus tenuidens Gervais, 1865, digits analysed (1st–5th toe, respectively), arranged by metatarsal size. Each bar represents the metatarsal and phalanx lengths measured in each specimen. First specimen in the plots is the unborn mesosaur specimen (FC-DPV 2504, Piñeiro et al. 2012a).
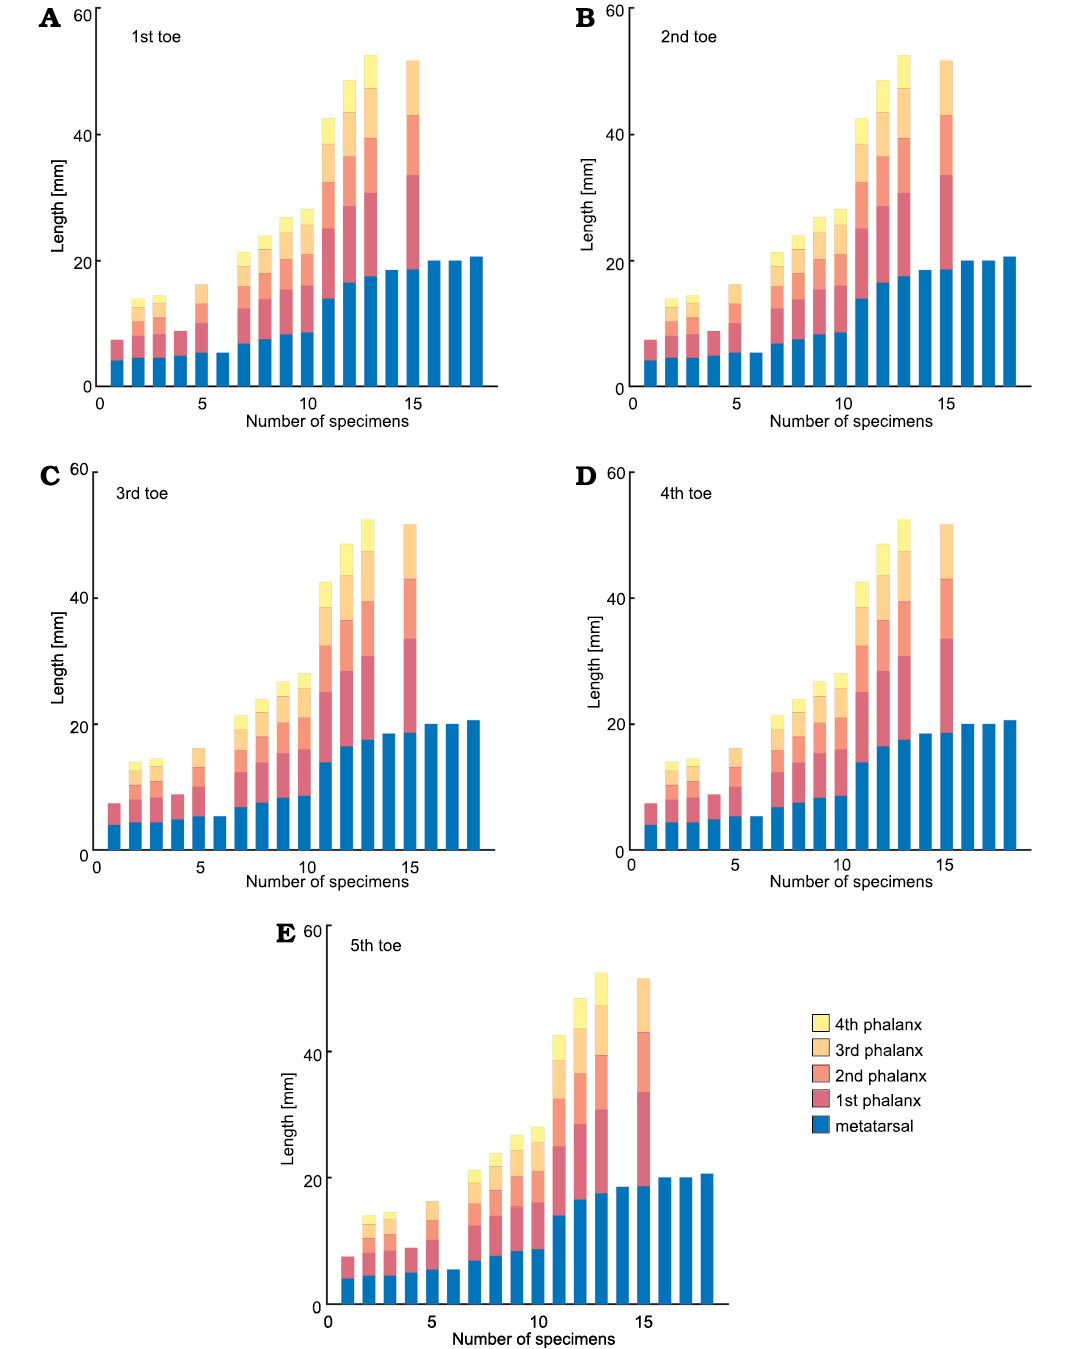
Fig. 21. A–E. Stacked bar diagram of Hovasaurus boulei Piveteau, 1926, digits analysed (1st–5th toe, respectively), arranged by metatarsal size. Each bar represents the metatarsal and phalanx lengths measured in each specimen.
Discussion
Isometry, size and maturity
Isometric growth is suggested as an ancestral feature in the development of early tetrapods (Olori 2013). The strong isometry and correlation observed between most of the mesosaur bones even allows reconstruction of the skeleton by only knowing the size of a single bone, as long as it can be correctly identified, with the exception of the scapulocoracoid and the ribs (see Piñeiro et al. 2021). Moreover, according to the present study, mesosaurs can be now classified ontogenetically by the size of their bones, which correlate with the grade of ossification of their carpal and tarsal bones (Piñeiro et al. 2016).
Further, isometric growth means that all body parts increase at the same rate and the juvenile proportions are not different from those of the adults. Although there is some natural variability in mesosaurs, it is limited. There are no particular specimens that exhibit great variation from others. However, regions or bones that display more variability than others can be identified, and we assume that they are subject to taphonomic features or ontogenetic variability. For example, the distal ends of the appendicular bones ossify late depending on age and possibly even denoting sexual dimorphism (Bonnan et al. 2008; Piñeiro et al. 2021), so, it is not surprising to find more noise in these measurements. In particular, Piñeiro et al. (2021) have shown that the ribs present enormous variability. Ribs are possibly the only bone in M. tenuidens that does not follow any pattern. There is no correlation between the mean width of the ribs and the mean width of the femur.
Isometric growth is a rare phenomenon among reptiles, and in general among tetrapods. Only some salamanders and frogs are known to display it (Protero 2013). Based on the comparison of cranial features of Paleozoic taxa, Olori (2013) suggested that isometric growth is a plesiomorphic developmental pattern, an ancestral feature of development in early tetrapods, by which there is a strong correlation among bones during growth.
Ontogenetic series provide valuable information about life history, developmental, and evolutionary patterns in extinct taxa. These series are based in morphological investigations of fossil growth series. These series are rarely preserved in the fossil record, and when preserved are often incomplete and difficult to interpret. Among Palaeozoic and early Mesozoic tetrapods the best data come from aquatic and semi-aquatic species (Caldwell 1994, 1997, 2002; Piñeiro et al. 2016; Fröbisch et al. 2010; Atkins et al. 2020; among others). That is the case for the fossil record of M. tenuidens, where we find one of the most complete ontogenetic series (Piñeiro et al. 2016). In the present study we expand mesosaur ontogenetic series identifying six stages of ossification using the proximal tarsals (astragalus, calcaneum, and navicular). Figure 14 summarizes the ossification degree and size of the different tarsal bones associated with ontogenetic stage. Moreover, we show that ontogenetic series correlate with size of the individuals, a fascinating feature of mesosaurs that is not seen in many other basal amniotes. As first approximation, we can state, based on ontogenetic series, that stage (i) characterizes the foetal stage, stages (ii) and (iii) the juveniles, stage (iv) the young adults (or sub-adults) and stages (v) and (vi) the “elder” adults (see also Piñeiro et al. 2016).
Incipient ossification of the astragalus and calcaneum suggests a juvenile specimen far from maturity. Young adults are characterized by a quadrangular astragalus in contact with a roughly triangular calcaneum, shaping an incipient foramen for the perforating artery, as well as rounded centralia (i.e., not developed navicular). Adults are characterized by a well-formed astragalus and calcaneum with a well-defined foramen for the perforating artery; a well-developed navicular of transversely elongated shape. The “elder” stage will be achieved when the navicular completes its fusion with the astragalus.
Something similar can be suggested for the carpus, which is devoid of ossified bones in the initial stages of development until the intermedium and the ulnare appear, along with a large central bone formed by the fusion of at least two bones. The appearance of an ossified distal carpal series and the fusion of intermedium with the central large bone (laterale centrale) purportedly complete the process of full maturity.
Previous and recent studies also suggest a strong correlation between tarsal development and scapulo-coracoid fusion, which not always is correlated with size (Piñeiro et al. 2016, 2021). The scapula and the coracoid are preserved isolated in young individuals, but they tend to suture and fuse with each other during ontogeny, forming a unitary structure in adults. However, there are cases where small scapulo-coracoids are completely fused, and other significantly larger ones show both bones only barely articulated (Piñeiro 2002; Piñeiro et al. 2021). This suggests a pattern of variable ossification, similar to that occurring with the distal carpals and tarsals. Unfortunately, the best-preserved scapulo-coracoids are disarticulated and isolated, thus precluding confident evaluation of the ontogenetic stage in which the fusion of these bones was completed, so a correlation of its size and status in relation to other bones should be studied further in the future.
On other hand, it is worth noting that long bone histology and skeletochronology have been considered as the most important and reliable tool for determining the absolute ontogenetic age of fossil vertebrates (Scheyer et al. 2010). However, the available histological information for mesosaurs (Nopcsa and Heidsieck 1934; Ricqlès 1974; Klein et al. 2019) presents several problems:
(i) Until now Mesosauridae has been considered as including three different species. However, recent research by Piñeiro et al. (2021), has shown that only Mesosaurus tenuidens is a valid taxon while “Stereosternum tumidum” and “Brazilosaurus sanpauloensis” are junior synonyms of the former, a statement that is supported by the results of the present study. Therefore, microanatomical studies based on the presence of differences associated with taxonomic assignation of the analyzed bones are questionable. For example, the study performed by Klein et al. (2019), where the authors found histological differences in the analyzed bones coming from some articulated skeletons that they assumed to belong to “S. tumidum” and to “B. sanpauloensis” by the presence of autapomorphies that are demonstrated to have no taxonomic relevance (e.g., Piñeiro 2002, 2006, 2008; Laurin and Piñeiro 2017; Piñeiro et al. 2021). Klein et al. (2019) analysed eleven specimens catalogued as “B. sanpauloensis” and reclassified ten of them as “S. tumidum” based on the number of presacral vertebrae, neck/skull ratio and degree of pachyosteosclerosis of the ribs. However Piñeiro et al. (2021) have shown that these criteria are not valid to separate three monotypic mesosaur taxa. Furthermore, Piñeiro et al. (2021) show that neck length against skull length ratio is constant and the same for all the purported species, i.e there is isometric growth between the neck and the skull, highly consistent with the results of the present study. Moreover, these authors did not describe the histology of M. tenuidens but rather they rely on the work of Ricqlès (1974), who describe a hindlimb and “fragments” of ribs and long bones, which a priori cannot be assigned to any species due the lack of diagnostic characters.
(ii) All the available studies concentrate on the pachyostosis or osteosclerosis of the specimens. None of the papers correlates or analyses the ontogenetic state of their specimens, except perhaps for one specimen studied by Ricqlès (1974).
(iii) According to Klein et al. (2019): “double or even multiple rest lines at the end of each cycle, making exact growth mark counts difficult and pointing to a high influence of exogenous (e.g., several growth season per annum) and endogenous (e.g., several reproduction cycles per annum) factors”. Moreover, Piñeiro et al. (2021) have argued about the possibility that variations in salinity are responsible for the variations observed in the pachyosteosclerosis of mesosaur ribs (see also Chang et al. 2008). It is worth remembering that the sea in which the mesosaurs lived dried up and evaporitic minerals were deposited mixed with events of high mortality (Piñeiro et al. 2012c). Despite these issues, according to our ontogenetic and developmental series, measurements for the humerus and femur reported by Klein et al. (2019) for their eleven studied specimens are consistent with the size expected for ontogenetic stages (iii), (iv), and (v). Thanks to images of some of the studied specimens kindly provided by the authors (Antoine Verrière, personal communication 2021) we could corroborate the ontogenetic stage in four of these specimens preserving the tarsus. Although Klein et al. (2019) state that there is no correlation of size with number of growth marks (age), eight out of eleven studied specimens do correlate well number of growth marks with humerus and femur lengths. In fact, removing only the two most extreme specimens, the correlation between size and reported age becomes 0.8 among the nine remaining specimens. According to their data, specimens in the stage (iii) would be between 1 or 2 years old, specimens in the stage (iv) would be between 2 to 4 years old, and specimens in the stage (v) between 4 and 5 years old. Moreover, Ricqlès (1974) analysed a specimen with a perfectly ossified tarsus, with a fused navicular (stage vi) suggesting that it is between 6 and 7 years old (see Ricqlès 1974: fig. 10).
The two most divergent specimens in Klein et al. (2019) belong purportedly to stage (iii), due to their size but were assigned age of at least 7 years old. However, without additional data, it is only possible to speculate on its implication. These are undoubtedly specimens that could be fundamental to validate both the ontogenetic series and the determination of an absolute age for mesosaurs from the study of histological sections. One possible explanation is that the endogenous and exogenous variations are so high that it is extremely difficult, if not impossible, to determine the age of mesosaurs through histological sections. Another possibility could be the existence of miniaturization among mesosaurs (Piñeiro et al. 2021), in that case, due to the strong isometry, these could not be differentiated from the rest but only by histological sections or the degree of pachyosteosclerosis. This could also account for previously discussed variations in ossification and for the differences previously attributed to the presence of more than one species of mesosaurs, currently synonymised to M. tenuidens.
Phalanx modularity and evolution
Phalanges form by a process of sequential segmentation along the toe axis. Each toe grows from the so-called “digit-forming region” continuously adding cells to the distal end of the bone. When the cartilage reaches a critical length, a segmentation process occurs, creating a joint behind the growing tip. The process is repeated several times, giving rise to the different phalanges (Kavanagh et al. 2013). Theory suggests that toes are morphological modules, strongly interrelated, in which development strongly controls the phenotypic variations.
The phalangeal and tarsal proportions of Mesosaurus tenuidens and Hovasaurus boulei are relatively constant throughout life; and as was noted by Currie (1981), this implies that they must have grown at approximately the same rate. Hovasaurus boulei has a strong modularity in each digit, but less linkage between them. The digits II–IV seem to have a modular behaviour sharing their proportions, while digits I and V diverge from the pattern; their first phalanx is much greater than expected, with almost the same size as the metatarsal. The penultimate phalanx in each toe of H. boulei is almost the same size (even slightly higher) than the previous phalanx, and this is seen as an almost constant pattern in the graphics (Figs. 17, 19, 21).
Such a feature is not noted in mesosaurs, in which, conversely, the lack of independence among metatarsals and phalanges suggests that there might be a strong developmental linkage between the formation of successive phalanges in a growing digit, where there is a dramatic decrease in size from phalanx to phalanx (Eble et al. 2005; Kavanagh et al. 2013; Young et al. 2015). This pattern involves a low degree of differentiation/parcellation of existing elements, probably associated with an ancestral evolutionary pattern (Piñeiro et al. 2016).
5th toe—the longest toe
It is quite unusual to find species with five or more digits that present the digital sequence ordered by size as seen in mesosaurs, with the fifth being the longest (Holder 1983). In general, animals that have total or partial loss of the digit V do present such character, but with the IV finger being the longest (see Holder 1983).
There are few references of animals possessing five digits with this character. Sea otters present a similar pattern in their hindlimbs (Adam 2009) and pinnipeds (Otariidae and Phocidae) in the forelimbs (Koretsky et al. 2016). Interestingly, phocids and sea otters swim by lateral undulation and use their fins/limbs as stabilizers, although they can alternate undulation with paddling (Tarasoff et al. 1972; Fish 1994). The same swimming pattern was suggested for mesosaurs, although mainly for their hindlimbs (Villamil et al. 2015). Moreover, pinnipeds are also semi-aquatic, a characteristic that was also suggested for mesosaurs (Núñez Demarco et al. 2018). Conceivably, this structural pattern derives from a convergent evolution by development of similar adaptive traits to semi-aquatic environments, but the differences between the compared groups are so great that it may be simply the result of stochastic evolution (Stayton 2015).
Implications of the isometric growth pattern found in mesosaurs regarding their controversial phylogenetic relationships
The suggested mesosaur–parareptilian relationship.—The phylogenetic relationships of mesosaurs are not yet resolved because they were found to be basal sauropsids (Laurin and Reisz 1995; Laurin and Piñeiro 2017, 2018) but other research placed them as basal parareptiles (e.g. Modesto 1999; Mac Dougall et al. 2018; Ford and Benson 2020). Indeed, in a recent phylogenetic study, Laurin and Piñeiro (2017) found that mesosaurs can occur in different positions, but always outside the smallest clade that includes all the other sauropsids, and in many trees they are the sister group of Amniota. Many characters support the basal phylogenetic position of mesosaurs, mainly because they are morphologically highly conservative (Piñeiro et al. 2012b; 2021).
Mesosaurs and parareptiles have several differences; at the level of the skull, mesosaurs possesses a synapsid-like small lower temporal fenestra, while most parareptiles are anapsids (see discussion in Piñeiro et al. 2012b and Laurin and Piñeiro 2017, 2018 for additional information), coincident to which can be expected in cotylosaurs (Romer 1956). Some specializations that have been considered as derived in mesosaurs, such as the long snout, the delicate and long teeth, and the pachyosteosclerosis of their skeleton (Canoville and Laurin 2010), are mainly adaptations to a semiaquatic lifestyle (Núñez Demarco et al. 2018). Conversely, parareptiles are mostly terrestrial. Even though mesosaurs share some features with parareptiles, such as the swollen morphology of the neural arches of dorsal vertebrae, a feature that is also present in other groups of basal amniotes as capthorinids and protorothyrids (e.g., Müller et al. 2006), some basal synapsids (e.g., Sumida 1989), and also in “microsaurian” lepospondyls (Vaughn 1962). Thus, we could assume that this is a plesiomorphic condition that has developed independently in these groups.
Regarding the phylogenetic hypotheses that suggested a mesosaur–parareptile relationship, we can see that after Gauthier et al. (1988), mesosaurs are basal to a clade formed by Procolophonia+Pareisauridae+Milleretidae. Other more recent papers including mesosaurs (e.g., Müller and Tsuji 2007), also show them in a basal position (almost like an outgroup), with respect to all other parareptilians, and when mesosaurs are considered as a clade formed by the three previously proposed taxa (M. tenuidens, “S. tumidum”, and “B. sanpauloensis”) (see Tsuji and Müller 2009: 78, fig. 3), they recovered unresolved relationships, as would be expected when comparing specimens belonging to the same taxon (Piñeiro et al. 2021). On the other hand, mesosaurs were not considered in the phylogenies of Lee (1997) and Rieppel and Reisz (1999) in their study of parareptilian relationships. More recently, studies performed by Mac Dougall et al. (2018) and Ford and Benson (2020) on early amniote relationships found mesosaurs nested within Parareptilia again at the basalmost position of this clade. The Mac Dougall et al. (2018) paper includes a critical view to a previously published phylogeny by Laurin and Piñeiro (2017) who reassessed the position of mesosaurs as the sister taxon of all other sauropsids. Laurin and Piñeiro (2017) found two main problems that may have produced that topology: (i) basing the analysis on an “outdated” matrix and therefore “ignoring” the hypotheses that have placed mesosaurs as basal parareptiles (obviously, the one that they support) and (ii) considering mesosaurs as having a synapsid-like temporal fenestra, which after Mac Dougall et al. (2018) is a character variable among the mesosaur species. Laurin and Piñeiro (2018) downplayed the concerns of Mac Dougall et al. (2018), mainly because not only the Laurin and Reisz (1995) matrix had been completely outdated but also because even considering mesosaurs as having a synapsid-like temporal fenestra, the mesosaur relationships were vindicated by the new analysis. Furthermore, the results from Laurin and Piñeiro (2017) were not as surprising as those from Mac Dougall et al. (2018), where parareptiles were nested within Diapsida and the “Pelycosauria” were recovered as paraphyletic.
Two years later, another study by Ford and Benson (2020) vindicated the topology of Mac Dougall et al. (2018) in which mesosaurs are nested within Parareptilia, but split them into M. tenuidens and “S. tumidum” with no explanation for the exclusion of “B. sanpauloensis”. This mesosaur topology recovered by Ford and Benson (2020), is improbable in light of the idea that “S. tumidum” has been recently demonstrated to be the junior synonym of M. tenuidens (Piñeiro et al. 2021). Moreover, the Ford and Benson (2020) paper also showed parareptiles nested within Diapsida, a result previously found by Piñeiro (2004, 2008), by Laurin and Piñeiro (2017), and Mac Dougall et al. (2018). Therefore, it is worth highlighting that it is a reluctant result obtained from differently coded and analyzed matrices. As in Mac Dougall et al. (2018), Ford and Benson (2020) also show a paraphyletic Synapsida, where varanopids are also nested within Diapsida. However, a revision of the character distribution in the taxa that support the new topology for the Varanopidae outside Synapsida, which historically, and until just few years ago, had been considered as the most diverse and long-lived group of basal synapsids (Reisz and Dilkes 2003), is worthwhile, mainly to verify that the results from Mac Dougall et al. (2018) and Ford and Benson (2020) were not influenced by misidentifications of diapsids as synapsids and vice versa, as has occurred more than once in the past (e.g., Reisz et al. 2010).
Mesosaurs as early amniotes.—As previously mentioned, the traditional study of Laurin and Reisz (1995) recovered mesosaurs to be basal sauropsids, which are the sister taxon of the Parareptilia+Eureptilia clade.
If this hypothesis is correct mesosaurs should share some more features with taxa that have been considered as the earliest reptiles such as Hylonomus lyelli (Carroll 1964) and particularly Westlothiana lizziae a taxon that was described as the oldest known reptile (Smithson 1989) and later degraded to a stem amniote tetrapod of uncertain relationship (Smithson et al. 1994, but see also Piñeiro et al. 2016). Considering that Mesosauridae seems to be represented by only M. tenuidens (Piñeiro et al. 2021) a possible phylogenetic frame may be to consider them as an early diverging basal sauropsid branch, being sterile in that they were not ancestral to any other later amniote group. However, this hypothesis would yet need to be corroborated. One way to do so is by calibrating M. tenuidens with respect to the earliest amniotes, i.e., Hylonomus lyelli and their roughly contemporaneous Paleothyris acadiana, and also to Westothiana lizzie, which although controversial, has been considered as a stem amniote in most analyses, and even very close to “microsaurs” (Marjanović and Laurin 2013; Didier et al. 2019). Only a few phylogenetic studies on early amniotes have included Hylonomus lyelli as an OTU, possibly because the holotype of its type species is a completely disarticulated specimen that does not allow the morphology of the temporal region of the skull to be clearly determined, although it was suggested that it resembled other basal eureptiles (Carroll 1964). Therefore, the Hylonomus lyelli skull restoration was not exclusively based on the holotype specimen (BM(NH) R.4168) but on other different materials found at the same locality, that consist also of disarticulated bones. Even still, a recent phylogeny (i.e., Ford and Benson 2020) recovered Hylonomus as the basalmost taxon of a clade including Anthracodromeus, Paleothyris, and Protorothyris, which is the sister group of Captorhinidae at the base of Reptilia; it is not recovered as the basalmost amniote. Perhaps a reappraisal of the comparative anatomy and relationships of all the specimens assigned to Hylonomus lyelli, including the holotype and the purported conspecifics and contemporaneous taxa from the Joggins Formation (Mann et al. 2020) would be necessary in order to update the identity of those materials upon which the oldest known reptile was restored.
Considering that mesosaurs have a conservative skeletal morphology, as can be expected for a basal amniote, and proving that isometry is the main mesosaur growth pattern as we have done herein, is outstanding and may introduce new hypotheses about their relationships that have not been considered before. Moreover, mesosaur hindlimb proportions are thought to be remarkably similar to those of stem-amniote (i.e., Gephyrostegus), amniotes (i.e., Captorhinus) but also stem-tetrapods (i.e., Tulerpeton curtum) (see Núñez Demarco et al. 2018: fig. 12) while the structure of its tarsus is very similar to that of Reptilia (i.e., Hylonomus, Captorhinus, Petrolacosaurus) or even “microsaurs” (i.e., Tuditanus, Pantylus) (see Piñeiro et al. 2016: fig. 10).
Unfortunately, it is not possible to evaluate the presence of similar growth patterns in Hylonomus and their relatives (Ford and Benson 2020) nor in other basal eureptiles, because the available number of individuals within each taxon is generally very low and it is not possible to test the rate of allometric changes that can occur during ontogenetic development, at least not with the precision that is observed in mesosaurs. Furthermore, we cannot affirm that the isometric growth is an aberrant or derived strategy exclusive for mesosaurs. On the contrary, we do know that isometry was the primary general growth pattern for some microsaurs, based on geometric morphometric analyses performed in large samples of Microbrachis pelikani and Hyloplesion longicostatum (100 and 18 specimens analysed, respectively). The obtained results have determined that the growth patterns in these taxa would be the ancestral condition for at least stem amniotes if not for Tetrapoda (Olori 2013, 2015).
The Lepospondyli (Zittel, 1888) are a highly diverse group (Orders: Microsauria, Adelospondyli, Aistopoda, Nectridea, Lysorophia) of small-to-mid sized tetrapods spanning from early Carboniferous to early Permian in age. Lepospondyli have been proposed both to be related to the origins of Lissamphibia (the “lepospondyl hypothesis”, e.g., Marjanović and Laurin 2009, 2013, 2019) or considered close of the origin of Reptilia or Amniota (i.e., Vaughn 1962; Carroll 1995; Anderson 2007; Pardo et al. 2017). Furthermore, recent phylogenetic and anatomical studies (Anderson 2007; Pardo et al. 2017; Pardo and Mann 2018; Mann and Maddin 2019; Mann et al. 2019, 2020, 2021) have further supported the polyphyly of Lepospondyli (e.g., aistopods as stem-tetrapods) and recovered a central core-grouping of “microsaurs” called the Recumbirostra (Anderson 2007; Huttenlocker et al. 2013) as crown-group amniotes. This recent result from Pardo et al. (2017) also recovers lysorophians within Recumbirostra (further supported by Mann et al. 2019), together both are recovered as early reptiles, while other lepospondyl clades remain as either stem amniotes (e.g., Nectridea) or stem-tetrapods (e.g., Aistopoda). Intriguingly, according to these authors, the new results should not affect the position of other taxa, particularly such of Westlothiana in the Amniota stem, even if this taxon is not included in the performed analysis.
Mesosaurus tenuidens and the evolutionary paths for the isometric growth pattern.—These previous studies and the results presented herein for Mesosaurus tenuidens allow us to strengthen previous hypotheses of stem and early amniote evolution (Olori 2013, 2015) and reassess isometry as the main growth pattern characterizing the earliest reptiles. According to what is known about growth patterns for later groups, allometry appears to be most common and widespread. To investigate this last hypothesis in extinct more derived sauropsid groups, we compared our results for M. tenuidens with the diapsid H. boulei, a Permian reptile from Madagascar that is thought to have had a similar lifestyle and for which an enough large sample is available (see above). We found that the growth pattern of H. boulei is not comparable to that seen in mesosaurs. Among other later fossil reptiles, there may be some kind of isometric growth in psittacosaur ceratopsian dinosaurs, meaning that the skull grows according to the age of the individual (Zhao et al. 2014). However, references for the postcranial skeleton are scarce and they suggest more or less marked allometry.
The evolutionary path for isometric growth in basal amniotes is shown in Fig. 22, taking into account the last and more widespread phylogenetic hypotheses. There, we can see that the most parsimonious hypothesis may be that shown in Fig. 22A, i.e., mesosaurs in a close relationship to some “lepospondyl” groups, unless isometry is considered as an evolutionary condition that was independently acquired by these taxa (Fig. 22B). In support of the first possibility, mesosaurs and some “lepospondyl” groups do not share only the isometric growth pattern, but also a particular combination of characters that would ally them, such as their elongated bodies, their tendency to lighten the skull by developing openings, the tendency to increase the number of presacral and caudal vertebrae, the possession of strongly amphicoelus vertebrae, swollen neural arches and the absence of suture lines between centrum and neural arches, as is common for the groups that form the stem Amniota (see Danto et al. 2016). The evolutionary significance of these combined shared characters should be analyzed in a phylogenetic context and perhaps new hypotheses of relationships may arise for mesosaurs.
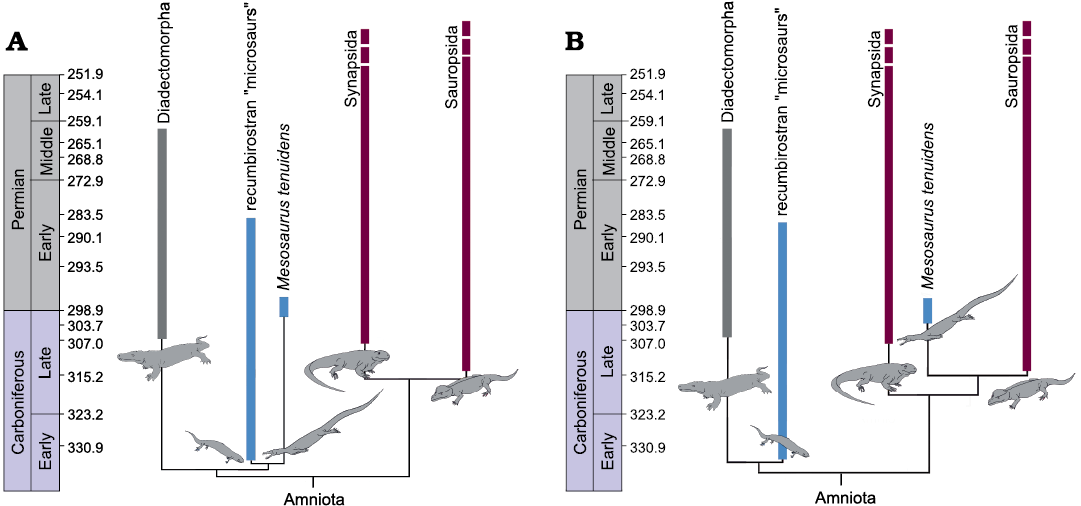
Fig. 22. Calibrated position of mesosaurs regarding the pattern of growth known for the groups represented. Blue bars represent taxa with isometric growth; purple bars represent those groups where allometric growth is the dominant pattern and grey bars are the groups where we do not have enough information to infer a growth pattern. A. Topology that suggest isometry as the most probable pattern for earliest amniotes. B. Topology that suggest that isometric growth pattern has been independently developed by recumbirostran “microsaurs” and mesosaurs. Simplified phylogenies of basal amniotes were based on hypotheses from Carroll (1995), Berman (2000), Olori (2015), Piñeiro et al. (2015), Liu and Bever (2015), Laurin and Piñeiro (2017), and Pardo et al. (2017). Chronostratigraphy is based on the 2018 Chart of the International Commission on Stratigraphy.
Methodological fitness
As can be seen, the employed methodology is not 100% accurate, because environmental and ecological factors could constrain the degree of ossification of the bones and the growth rate. Nevertheless, it has enormous potential, particularly for the classification or identification of disarticulated material. Therefore, our results can be useful for the identification of different individuals represented in bone beds as well as their ontogenetic stages. It also allows for recognition of size groups in the complex preservation of several juxtaposed individuals, increasing our understanding of biological behaviours of the species.
Furthermore, the morphometric studies performed herein permit us to support the hypothesis that mesosaurs are represented by only one species. Perhaps diagnostic characters were more evident at the level of soft tissues or different biological behaviours, but this is difficult to ascertain from fossils. Our study also supports recent studies that suggest that the variation observed in mesosaurs is due to ontogeny, intraspecific variability derived from environmental factors, and/or from taphonomy, and possibly sexual dimorphism (Piñeiro et al. 2021). In this sense, it is worth noting that isometry is commonly associated with low morphological diversity (McNamara 1997; Sears et al. 2007; Sanchez-Villagra 2010).
Conclusions
The morphometric study performed herein represents the first ontogenetic reconstruction of the cranial and postcranial ossification sequence in mesosaurs. More than one hundred specimens examined, including the skull, vertebral column and limbs of Mesosaurus tenuidens, have demonstrated isometric growth for mesosaurs during their development, meaning that there is a notable relationship between age and size. Isometric growth implies that all body parts increase in size at the same rate and the juvenile proportions are not different from those of the adults. This is a rare phenomenon among reptiles, and also among tetrapods.
Comparative morphometric analyses performed on a more derived sauropsid such as Hovasaurus boulei suggest that while this taxon is adapted to semiaquatic environments like mesosaurs, it stopped growing at a determinate size, so is represented by small juvenile and larger adult individuals. In contrast, mesosaurs display a continuous and gradual growth pattern with individuals representing all the ontogenetic stages.
The anatomical structure of the carpus was also reappraised and a review of the available literature revealed substantial subjectivity among the authors that described it. The present study shows that the identity of the constituent carpal bones (as consistently with the tarsals) depends on the degree of ossification and fusion of the elements throughout ontogeny. Therefore, the differences previously proposed to separate mesosaur taxa on the basis of carpus (and tarsus) structure cannot be supported.
The phalangeal and tarsal proportions of M. tenuidens and H. boulei are relatively constant throughout life, and both have strong modularity in each digit. However, in mesosaurs there might be a strong developmental linkage between the formation of successive phalanges in a growing digit, with a dramatic decrease in size from phalanx to phalanx. Moreover, the strong modularity among metatarsals and phalanges seen in mesosaurs is also very unusual and suggests a very primitive pattern.
Furthermore, the morphometric data obtained in this study strongly support the hypothesis that there is no more than one mesosaur species, and the variations observed reflect the influence of environmental conditions, taphonomical features and intraspecific variation (Piñeiro et al. 2021).
Detection of isometric growth in mesosaurs is consistent with previous observations that suggested the presence of plesiomorphic features in their anatomy (Huene 1940, 1941; Piñeiro et al. 2016; Núñez Demarco et al. 2018). Many of these features along with the isometric pattern of growth are shared with those present in “microsaurian” tetrapods which were recovered as basal amniotes in recent phylogenies (Pardo et al. 2017; Mann et al. 2019; Gee et al. 2021). The results obtained herein would be relevant to reassess mesosaur phylogenetic relationships and to support recent radiometric and biostratigraphic studies in the mesosaur-bearing Mangrullo Formation of Uruguay, which suggest that mesosaurs may be older amniotes than previously thought (Calisto and Piñeiro 2019).
In light of the new results, we are willing to suggest that mesosaurs were not the oldest group of reptiles that returned to the aquatic environment and that their ancestors may have been animals that were adapted to live within or close to water bodies.
Acknowledgements
We specially thank Pablo Velozo (Universidad de la República, Facultad de Ciencias, Montevideo, Uruguay) for have taken the photographs of the Hovasaurus boulei specimens housed at the Museum National d’Histoire Naturelle of Paris, France and Melitta Meneghel (Universidad de la República, Facultad de Ciencias, Montevideo, Uruguay) for valuable comments and suggestions on the original manuscript. We are very indebted to James O. Farlow (Department of Geociences, Indiana University-Purdue University, Fort Wayne, USA) and to Arjan Mann (Carleton University, Ottawa, Canada) for their useful comments and suggestions that very much improved the first version of this manuscript. Facultad de Ciencias, National Geographic and ANII grants to GP and JF, financed the different steps of research that derived in the present study.
References
Adam, J.P. 2009. Hind limb anatomy. In: W.F. Perrin, B. Würsig, and J.G.M. Thewissen (eds.), Encyclopedia of Marine Mammals (Second Edition), 562–565. Academic Press, San Diego. Crossref
Anderson, J.S. 2007. Incorporating ontogeny into the matrix: a phylogenetic evaluation of developmental evidence for the origins of modern amphibians. In: J.S. Anderson and H.-D. Sues (eds.), Major Transitions in Vertebrate Evolution, 182–227. Indiana University Press, Bloomington.
Anderson, T.L., Ousterhout, B.H., Drake, D.L., Burkhart, J.J., Rowland, F.E., Peterman, W.E., and Semlitsch, R.D. 2016. Differences in larval allometry among three ambystomatid salamanders. Journal of Herpetology 50: 464–470. Crossref
Araújo, D. C. 1977. Taxonomia e relações dos Proganosauria da Bacia do Paraná. Anais da Academia Brasileira de Ciências 48: 91–116.
Atkins, J.B., Sourges, P., Fröbisch, N.B., Reisz, R.R., and Maddin, H.C. 2020. Late ontogeny in the small Early Permian amphibamiform dissorophoid Pasawioops mayi. Journal of Vertebrate Paleontology 40 (2): art. e1772800. Crossref
Berman, D. 2000. Origin and early evolution of the amniote occiput. Journal of Paleontology 74: 938–956. Crossref
Bickelmann, C. and Tsuji, L.A. 2018. A case study of developmental palaeontology in Stereosternum tumidum (Mesosauridae, Parareptilia). Fossil Record 21: 109–118. Crossref
Bonnan, M.F. 2004. Morphometric analysis of humerus and femur shape in Morrison sauropods: implications for functional morphology and paleobiology. Paleobiology 30: 444–470. Crossref
Bonnan, M.F. 2007. Linear and geometric morphometric analysis of long bone scaling patterns in Jurassic neosauropod dinosaurs: their functional and paleobiological implications. The Anatomical Record: Advances in Integrative Anatomy and Evolutionary Biology 290: 1089–1111. Crossref
Bonnan, M.F., Farlow, J.O., and Masters, S.L. 2008. Using linear and geometric morphometrics to detect intraspecific variability and sexual dimorphism in femoral shape in Alligator mississippiensis and its implications for sexing fossil archosaurs, Journal of Vertebrate Paleontology 28: 422–431. Crossref
Caldwell, M.W. 1994. Developmental constraints and limb evolution in Permian and modern lepidosauromorph diapsids. Journal of Vertebrate Paleontology 14: 459–471. Crossref
Caldwell, M.W. 1997. Limb ossification patterns of the ichthyosaur Stenopterygius, and a discussion of the proximal tarsal row of ichthyosaurs and other neodiapsid reptiles. Zoological Journal of the Linnean Society 120:1–25. Crossref
Caldwell, M.W. 2002. From fins to limbs to fins: limb evolution in fossil marine reptiles. American Journal of Medical Genetics 112: 236–249. Crossref
Calisto, V. and Piñeiro, G. 2019. A large cockroach from the mesosaur-bearing Konservat-Lagerstätte (Mangrullo Formation), Late Paleozoic of Uruguay. PeerJ 7: e6289. Crossref
Carroll, R.L. 1964. The earliest reptiles. Zoological Journal of the Linnean Society 45: 61–83. Crossref
Carroll, R. 1981. Plesiosaur ancestors from the Upper Permian of Madagascar. Philosophical Transactions of the Royal Society B 293: 315–383. Crossref
Carroll, R.L. 1982. Early evolution of reptiles. Annual Review of Ecology and Systematics 13: 87–109. Crossref
Carroll, R.L. 1988. Vertebrate Paleontology and Evolution. 698 pp. W.H. Freeman, New York.
Carroll, R.L. 1995. Problems of the phylogenetic analysis of Paleozoic choanates. Bulletin du Muséum National d’Histoire Naturelle Section C Series 4 17: 389–445.
Canoville, A. and Laurin, M. 2010. Evolution of humeral microanatomy and lifestyle in amniotes, and some comments on paleobiological inferences. Biological Journal of the Linnean Society 100: 384–406. Crossref
Chang, M., Wang, X., Liu, H., Miao, D., Zhao, Q., Wu, G., Liu, J., Li, Q., Sun, Z., and Wang, N. 2008. Extraordinarily thick-boned fish linked to the aridification of the Qaidam Basin (northern Tibetan Plateau). Proceedings of the National Academy of Sciences 105:13246–13251. Crossref
Cope, E.D. 1885. A contribution to the vertebrate paleontology of Brazil. Paleontological Bulletin 40: 1–21.
Currie, P.J. 1981. Hovasaurus boulei, an aquatic eosuchian from the upper Permian of Madagascar. Palaeontographica Africana 24: 99–168.
Danto, M., Witzmann, F., and Fröbisch, N. 2016. Vertebral development in Paleozoic and Mesozoic tetrapods revealed by paleohistological data. PLoS One 11 (4): e0152586. Crossref
Didier, G. Chabrol, O., and Laurin, M. 2019. Parsimony-based test for identifying changes in evolutionary trends for quantitative characters: implications for the origin of the amniotic egg. Cladistics 35: 576–599. Crossref
Eble, G.J. 2005. Morphological modularity and macroevolution: conceptual and empirical aspects. In: W. Callebaut and D. Rasskin-Gutman (eds.), Modularity. Understanding the Development and Evolution of Natural Complex Systems, 221–238. MIT Press, Cambridge.
Fabrezi, M., Abdala, V., and Martínez Oliver, M.I. 2007. Developmental basis of limb homology in lizards. The Anatomical Record 290: 900–912. Crossref
Farlow, J.O. 2018. Noah’s Ravens: Interpreting the Makers of Tridactyl Dinosaur Footprints. 800 pp. Indiana University Press, Bloomington. Crossref
Feng, C., Wang, H., Lu, N., Chen, T., He, H., Lu, Y., and Tu, X.M. 2014. Log-transformation and its implications for data analysis. Shanghai Archives of Psychiatry 26: 105–109.
Fish, F.E. 1994. Association of propulsive swimming mode with behaviour in river otters (Lutra canadensis). Journal of Mammalogy 75: 989–997. Crossref
Ford, D.P. and Benson, R.B.J. 2020. The phylogeny of early amniotes and the affinities of Parareptilia and Varanopidae. Ecology and Evolution 4: 57–65. Crossref
Fröbisch, N.B., Olori, J.C., Schoch, R.R., and Witzmann, F. 2010. Amphibian ontogeny in the fossil record. Seminars in Cell & Developmental Biology 21: 424–431. Crossref
Gauthier, J.A., Kluge, G., and Rowe, D.T. 1988. The early evolution of Amniota. In: M.J. Benton (ed.), The Phylogeny and Classification of the Tetrapods. Vol. 1. Amphibians, Reptiles and Birds. Systematics Association Special Volume 35A: 103–155.
Gee, B.M., Bevitt, J.J., and Reisz, R.R. 2021. Computed tomographic analysis of the cranium of the early Permian recumbirostran “microsaur” Euryodus dalyae reveals new details of the braincase and mandible. Papers in Palaeontology 7: 721–749. Crossref
Gervais, P. 1865. Description du Mesosaurus tenuidens, reptile fossile de l’Afrique australe. Académie des Sciences et Lettres de Montpellier Mémoires de la Section des Sciences 6: 169–175.
Holder, N. 1983. Developmental constraints and the evolution of vertebrate digit patterns. Journal of Theoretical Biology 104: 451–471. Crossref
Huene F. von 1940. A idade Permiana inferior de todas as camadas contendo mesossáurios. Divisão de Mineração e Metalurgia 6: 64–68.
Huene F. von 1941. Osteologie und systematische Stellung von Mesosaurus. Palaeontographica A 92: 45–58.
Huttenlocker, A.K., Pardo, J.D., Small, B.J., and Anderson, J. 2013. Cranial morphology of recumbirostrans (Lepospondyli) from the Permian of Kansas and Nebraska, and early morphological evolution inferred by micro-computed tomography. Journal of Vertebrate Paleontology 33: 540–552. Crossref
Huxley, J.S. 1924. Constant differential growth rates and their significance. Nature 144: 895–896. Crossref
Jolicoeur, P. and Mosimann, J.E. 1968. Intervalles de confiance pour la pente de l’axe majeur d’une distribution normale bidimensionnelle. Biométrie-Praximétrie 9: 121–140.
Kavanagh, K.D., Shoval, O., Winslow, B.B., Alon, U., Leary, B.P., Kan, A., and Tabin, C.J. 2013. Developmental bias in the evolution of phalanges. Proceedings of the National Academy of Sciences 110: 18190–18195. Crossref
Klein, N., Verrière, A., Sartorelli, H., Wintrich, T., and Fröbisch, J. 2019. Microanatomy and growth of the mesosaurs Stereosternum tumidum and Brazilosaurus sanpauloensis (Reptilia, Parareptilia). Fossil Record 22: 91–110. Crossref
Koretsky, I.A., Barnes, L.G., and Rahmat, S.J. 2016. Re-evaluation of morphological characters questions current views of pinniped origins. Vestnik zoologii 50: 327–354. Crossref
Kowalewski, M. and Novack-Gottshall, P.M. 2010. Resampling methods in paleontology. Quantitative methods in paleobiology. Short Courses in Paleontology 16: 19–54. Crossref
Kuhn, O. 1969. Handbuch der Paläoherpetologie, Teil 9. 73 pp. Gustav Fischer Verlag, Stuttgart.
Laurin, M. and Reisz, R.R. 1995. A reevaluation of early amniote phylogeny. Zoological Journal of the Linnean Society 113: 165–223. Crossref
Laurin, M. and Buffrénil, V. de 2016. Microstructural features of the femur in early ophiacodontids: a reappraisal of ancestral habitat use and lifestyle of amniotes. Comptes Rendus Palevol 15: 115–127. Crossref
Laurin, M. and Piñeiro, G.H. 2017. A reassessment of the taxonomic position of mesosaurs, and a surprising phylogeny of early amniotes. Frontiers in Earth Science 5: 88. Crossref
Laurin, M. and Piñeiro, G.H. 2018. Response: Commentary: A reassessment of the taxonomic position of mesosaurs, and a surprising phylogeny of early amniotes. Frontiers in Earth Science 6: 220. Crossref
Leduc, D.J. 1987. A comparative analysis of the reduced major axis technique of fitting lines to bivariate data. Canadian Journal of Forest Research 17: 654–659. Crossref
Lee, M.S.Y. 1997. Pareiasaur phylogeny and the origin of turtles. Zoological Journal of the Linnean Society 120: 197–280. Crossref
Liu, J. and Bever, G.S. 2015. The last diadectomorph sheds light on Late Palaeozoic tetrapod biogeography. Biological Letters 11: 20150100. Crossref
Mann, A., Gee, B.M., Pardo, J.D., Marjanović, D., Adams, G.R., Calthorpe, A.S., and Anderson, J.S. 2020. Reassessment of historic “microsaurs” from Joggins, Nova Scotia, reveals hidden diversity in the earliest amniote ecosystem. Papers in Palaeontology 6: 605–625. Crossref
Mann, A. and Maddin, H.C. 2019. Diabloroter bolti, a short-bodied recumbirostran “microsaur” from the Francis Creek Shale, Mazon Creek, Illinois. Zoological Journal of the Linnean Society 187: 494–505. Crossref
Mann, A., Calthorpe, A.S., and Maddin, H.C. 2021. Joermungandr bolti, an exceptionally preserved “microsaur” from the Mazon Creek Lagerstätte reveals patterns of integumentary evolution in Recumbirostra. Royal Society Open Science 8 (7): 210319. Crossref
Mann, A., Pardo, J.D., and Maddin, H.C. 2019. Infernovenator steenae, a new serpentine recumbirostran from the “Mazon Creek” Lagerstätte further clarifies lysorophian origins. Zoological Journal of the Linnean Society 187: 506–517. Crossref
Mac Dougall, M.J., Modesto, S.P., Brocklehurst, N., Verrière, A., Reisz, R.R., and Fröbisch, J. 2018. Commentary: a reassessment of the taxonomic position of mesosaurs, and a surprising phylogeny of early amniotes. Frontiers in Earth Science 6: 99. Crossref
Mac Gregor, J.H. 1908. On Mesosaurus brasiliensis nov. sp. from the Permian of Brasil. In: I.C. White (ed.), Commissão dos Estudos das Minas de Carvão de Pedra do Brasil, Parte II, 301–336. National Press, Rio de Janeiro
McArdle, B. 1988, The structural relationship: regression in biology. Canadian Journal of Zoology 66: 2329–2339. Crossref
McNamara, K. 1997. Shapes of Time: The Evolution of Growth and Development. First Edition. 360 pp. Johns Hopkins University Press, Baltimore.
Marjanović, D. and Laurin, M. 2009. The origin(s) of modern amphibians: a commentary. Evolutionary Biology 36: 336–338. Crossref
Marjanović, D. and Laurin, M. 2013. The origin(s) of extant amphibians: a review with emphasis on the “lepospondyl hypothesis”. Geodiversitas 35: 207–272. Crossref
Marjanović, D. and Laurin, M. 2019. Phylogeny of Paleozoic limbed vertebrates reassessed through revision and expansion of the largest published relevant data matrix. PeerJ 6:e5565. Crossref
Mitteroecker, P. and Bookstein, F. 2007. The conceptual and statistical relationship between modularity and morphological integration. Systematic Biology 56: 818–836. Crossref
Modesto, S.P. 1996. The Anatomy, Relationships, and Palaeoecology of Mesosaurus tenuidens and Stereosternum tumidum (Amniota: Mesosauridae) from the Lower Permian of Gondwana. 280 pp. Unpublished Ph.D. Thesis, University of Toronto, Toronto.
Modesto, S.P. 1999. Observations on the structure of the Early Permian reptile Stereosternum tumidum Cope. Palaeontologia Africana 35:7–19.
Modesto, S.P. 2006. The cranial skeleton of the Early Permian aquatic reptile Mesosaurus tenuidens: implications for relationships and palaeobiology. Zoological Journal of the Linnean Society 146: 345–368. Crossref
Modesto, S.P. 2010. The postcranial skeleton of the aquatic parareptile Mesosaurus tenuidens from the Gondwanan Permian. Journal of Vertebrate Paleontology 30: 1378–1395. Crossref
Modesto, S.P., Scott, D.M., Mac Dougall, M.J., Sues, H.-D., Evans, D.C., and Reisz, R.R. 2015. The oldest parareptile and the early diversification of reptiles. Proccedings of the Royal Society B 282: 20141912. Crossref
Müller, J. and Tsuji, L.A. 2007. Impedance-matching hearing in Paleozoic reptiles: evidence of advanced sensory perception at an earlystage of amniote evolution. PloS ONE 2 (9): e889. Crossref
Müller, J., Berman, D.S., Henrici, A.C., Martens, T., and Sumida, S.S. 2006. The basal reptile Thuringothyris mahlendorffae (Amniota: Eureptilia) from the Lower Permian of Germany. Journal of Paleontology 80: 726–739. Crossref
Nopcsa, F. von and Heidsieck, E. 1934. Über eine pachyostotische Rippe auf der Kreide Rügens. Acta Zoologica 15: 431–455. Crossref
Núñez Demarco, P., Meneghel, M., Laurin, M., and Piñeiro, G. 2018. Was Mesosaurus a fully aquatic reptile? Frontiers in Ecology and Evolution 6: 109. Crossref
Oelofsen, B.W. 1981. An Anatomical and Systematic Study of the Family Mesosauridae (Reptilia, Proganosauria) with Special Reference to Its Associated Fauna and Palaeoecological Environment in the Whitehill Sea. 250 pp. Unpublished Ph.D. Thesis, University of Stellenbosch, Stellenbosch.
Oelofsen, B. and Araújo, D.C. 1987. Mesosaurus tenuidens and Stereosternum tumidum from the Permian Gondwana of both southern Africa and South America. South African Journal of Science 83: 370–372.
Olori, J.C. 2013. Morphometric analysis of skeletal growth in the lepospondyls Microbrachis pelikani and Hyloplesion longicostatum (Tetrapoda, Lepospondyli). Journal of Vertebrate Paleontology 33 (6): 1300–1320. Crossref
Olori, J. 2015. Skeletal morphogenesis of Microbrachis and Hyloplesion (Tetrapoda: Lepospondyli) and implications for the developmental patterns of extinct, early tetrapods. PLoS One 10 (6): e0128333. Crossref
Pardo, J.D. and Mann, A. 2018. A basal aistopod from the earliest Pennsylvanian of Canada, and the antiquity of the first limbless tetrapod lineage. Royal Society Open Science 5 (12): 181056. Crossref
Pardo, J.D., Szostakiwskyj, M., Ahlberg, P.E., and Anderson, J.S. 2017. Hidden morphological diversity among early tetrapods. Nature Letters 546: 1–12. Crossref
Piñeiro, G. 2002. Paleofaunas del Pérmico-Eotriásico de Uruguay. 208 pp. Unpublished M.Sc. Thesis, PEDECIBA, Universidad de la República, Montevideo.
Piñeiro, G. 2004. Paleofaunas del Pérmico y Permo-Triásico de Uruguay: Bioestratigrafía, Paleobiogeografía y Sistemática. 206 pp. Unpublished Ph.D. Thesis, PEDECIBA, Universidad de la República, Montevideo.
Piñeiro, G. 2006. Nuevos aportes a la paleontología del Pérmico de Uruguay. In: G. Veroslavsky, S. Martínez, and M. Ubilla (eds.), Cuencas Sedimentarias de Uruguay Paleozoico, 257–279. DIRAC, Facultad de Ciencias, Montevideo.
Piñeiro, G. 2008. Los mesosaurios y otros fósiles de fines del Paleozoico. In: D. Perea (ed), Fósiles de Uruguay, 179–205. DIRAC, Facultad de Ciencias, Montevideo.
Piñeiro, G., Ferigolo, J., Meneghel, M., and Laurin, M. 2012a. The oldest known amniotic embryos suggest viviparity in mesosaurs. Historical Biology 24: 630–640. Crossref
Piñeiro, G., Ferigolo, J., Mones, A., and Núñez Demarco, P. 2021. Mesosaur taxonomy reappraisal: are Stereosternum and Brazilosaurus valid taxa? Revista Brasileira de Paleontologia 24: 205–235. Crossref
Piñeiro, G., Ferigolo, J., Ramos, A., and Laurin, M. 2012b. Cranial morphology of the Early Permian mesosaurid Mesosaurus tenuidens and the evolution of the lower temporal fenestration reassessed. Comptes Rendus Palevol 11: 379–391. Crossref
Piñeiro, G., Ferigolo, J., Ribeiro, A.M., and Velozo, P. 2015. Reassessing the affinities of vertebral remains from Permo-Triassic beds of Gondwana. Comptes Rendus Palevol 14: 387–401. Crossref
Piñeiro, G., Núñez Demarco, P., and Meneghel, M.D. 2016. The ontogenetic transformation of the mesosaurid tarsus: a contribution to the origin of the primitive amniotic astragalus. PeerJ 4: e2036. Crossref
Piñeiro, G., Ramos, A., Goso, C., Scarabino, F., and Laurin, M. 2012c. Unusual environmental conditions preserve a Permian mesosaur-bearing Konservat-Lagerstätte from Uruguay. Acta Palaeontologica Polonica 57: 299–318. Crossref
Piveteau, J. 1926. Paleontologie de Madagascar, XIII. Amphibiens et reptiles permiens. Annales de Paléontologie 15: 53–180.
Protero, D.R. 2013. Bringing Fossils to Life. An Introduction to Paleobiology. Third Edition. 672 pp. Columbia University Press, New York.
Reisz, R.R. and Dilkes, D.W. 2003. Archaeovenator hamiltonensis, a new varanopid (Synapsida: Eupelycosauria) from the Upper Carboniferous of Kansas. Canadian Journal of Earth Science 40: 667–678. Crossref
Reisz, R.R., Laurin, M., and Marjanović, D. 2010. Apsisaurus whitteri from the Lower Permian of Texas: yet another small varanopid, not a diapsid. Journal of Vertebrate Paleontology 30: 1628–1631. Crossref
Ricker, W.E. 1973. Linear regression in fishery research. Journal of Fishing Research Board of Canada 30: 409–434. Crossref
Ricqlès, A. 1974. Recherches paléohistologiques sur les os longs des tétrapodes IV. – Eothériodontes et pélycosaures. Annales de Paleontologie 60: 1–39.
Rieppel, O. and Reisz, R.R. 1999. The origin and early evolution of turtles. Annual Review of Ecology and Systematics 30: 1–22. Crossref
Romer, A.S. 1956. Osteology of the Reptiles. 772 pp. University Chicago Press, Chicago.
Romer, A.S. 1957. Origin of the amniote egg. The Scientific Monthly 85: 57–63.
Romer, A.S. 1966. Vertebrate Paleontology. 3rd Edition. 687 pp. University of Chicago Press, Chicago.
Rossmann, T. 2000. Studien an Mesosauriern (Amniota inc. sed.: Mesosauridae): 2. Neue Erkenntnisse zur Anatomie, mit Berücksichtigung der Taxonomie von Mesosaurus pleurogaster (Seeley). Senckenbergiana lethaea 80: 13–28. Crossref
Rubenstein, N.M. 1971. Ontogenetic allometry in the salamander genus Desmognathus. American Midland Naturalist 85: 329–348. Crossref
Sanchez-Villagra, M.R. 2010. Developmental palaeontology in synapsids: the fossil record of ontogeny in mammals and their closest relatives. Proceedings of the Royal Society B: Biological Sciences 277: 1139–1147. Crossref
Santos, R.V., Souza, P.A., Alvarenga, C.J.S. de, Dantas, E.L., Pimentel, M.M., Oliveira, C.G. de, and Araújo, L.M. de 2006. Shrimp U-Pb zircon dating and palynology of bentonitic layers from the Permian Irati Formation, Paraná Basin, Brazil. Gondwana Research 9: 456–463. Crossref
Scheyer, T.M., Klein, N., and Sander, P.M. 2010. Developmental palaeontology of Reptilia as revealed by histological studies. In: M.R. Sánchez-Villagra (ed.), Developmental Vertebrate Palaeontology. Seminars in Cell and Developmental Biology 21: 462–470. Crossref
Sears, K.E., Goswami, A., Flynn, J.J., and Niswander, L.A. 2007. The correlated evolution of Runx2 tandem repeats, transcriptional activity, and facial length in carnivora. Evolution & Development 9: 555–565. Crossref
Seeley, H.G. 1892. The Mesosauria of South Africa. Quarterly Journal of the Geological Society 48: 586–604. Crossref
Shikama, T. and Ozaki, H. 1966. On a reptilian skeleton from the Paleozoic formation of São Paulo, Brazil. Transaction Proceedings of the Paleontological Society of Japan 64: 351–358.
Shubin, N.H. and Alberch, P. 1986. A morphogenetic approach to the origin and basic organization of the tetrapod limb. Evolutionary Biology 20: 319–387. Crossref
Smith, R.J. 2009. Use and misuse of the reduced major axis for line fitting. American Journal of Physical Anthropology 140 (3): 476–486. Crossref
Smithson, T.R. 1989. The earliest known reptile. Nature 342: 676–677. Crossref
Smithson, R.T., Carroll, R.L., Panchen, A.L., and Andrews, S.M. 1994. Westlothiana lizziae from the Viséan of East Kirkton, West Lothian, Scotland, and the amniote stem. Transactions of the Royal Society of the Edinburgh, Earth Sciences 84: 383–412. Crossref
Snell, O. 1892. Die Abhängigkeit des Hirngewichts von dem Körpergewicht und den geistigen Fähigkeiten. Archives of Psychiatric Nursing 23: 436–446. Crossref
Stayton, C.T. 2015. What does convergent evolution mean? The interpretation of convergence and its implications in the search for limits to evolution. Interface Focus 5 (6): 20150039. Crossref
Sumida, S.S. 1989. Reinterpretation of vertebral structure in the Early Permian pelycosaur Varanosaurus acutirostris (Amniota: Synapsida). Journal of Vertebrate Paleontology 9: 451–458. Crossref
Tarasoff, F.J., Bisaillon, A., Piérard, J., and Whitt, A.P. 1972. Locomotory patterns and external morphology of the river otter, sea otter, and harp seal (Mammalia). Canadian Journal of Zoology 50: 915–929. Crossref
Trujillo-Ortiz, A. and Hernandez-Walls, R. 2010. Gmregress: Geometric Mean Regression (Reduced Major Axis Regression). A MATLAB file. http://www.mathworks.com/matlabcentral/fileexchange/27918-gmregress
Tsuji, L.A and Müller, J. 2009. Assembling the history of the Parareptilia: phylogeny, diversification, and a new definition of the clade. Fossil Record 12: 71–81. Crossref
Tsuji, L.A., Müller, J., and Reisz, R.R. 2012. Anatomy of Emeroleter levis and the phylogeny of the nycteroleter parareptiles. Journal of Vertebrate Paleontology 32: 45–67. Crossref
Vaughn, P.P. 1962. The Paleozoic Microsaurs as close relatives of reptiles, again. The American Midland Naturalist 67: 79–84. Crossref
Villamil, J., Núñez Demarco, P., Meneghel, M., Blanco, R.E., Jones, W., Rinderknecht, A., Laurin, M., and Piñeiro, G. 2015. Optimal swimming speed estimates in the Early Permian mesosaurid Mesosaurus tenuidens Gervais, 1865 from Uruguay. Historical Biology 28: 963–971. Crossref
Wegener, A. 1966. The Origin of Continents and Oceans. [English translation of the German 4th edition, from 1929]. 246 pp. Dover Publications, Inc., New York.
Young, N.M., Winslow, B., Takkellapati, S., and Kavanagh, K. 2015. Shared rules of development predict patterns of evolution in vertebrate segmentation. Nature Communications 6 (1): 1–7. Crossref
Zhao, Q., Benton, M.J., Xu, X., and Sander, P.M. 2014. Juvenile-only clusters and behaviour of the Early Cretaceous dinosaur Psittacosaurus. Acta Palaeontologica Polonica 59: 827–833. Crossref
Zar, J. 1999. Biostatistical Analysis. 4th Edition. 931 pp. Prentice Hall, Upper Saddle River.
Zittel, K.A. von 1888. Handbuch der Paläontologie. Abteilung 1. Paläozoologie Band III. Vertebrata (Pisces, Amphibia, Reptilia, Aves). 971 pp. Oldenbourg, Munich.
Acta Palaeontol. Pol. 67 (2): 509–542, 2022
https://doi.org/10.4202/app.00931.2021