
Re-evaluating hypertragulid diversity in the John Day basin, Oregon, USA
NICHOLAS A. FAMOSO and LANA K. JEWELL
Famoso, N.A. and Jewell, L.K. 2024. Re-evaluating hypertragulid diversity in the John Day basin, Oregon, USA. Acta Palaeontologica Polonica 69 (3): 411–423.
Despite their relative abundance, members of the family Hypertragulidae (Artiodactyla, Mammalia) have proved a conundrum regarding species diversity in the Turtle Cove Member (Oligocene) of the John Day Formation, located in central and eastern Oregon. Three species and two separate genera are described in the area, but previous research lacks statistical support for this level of variation. We use coefficients of variation (V) on measurements of dentition and astragali of hypertragulid specimens designated Hypertragulus hesperius, Hypertragulus minutus, and Nanotragulus planiceps as a metric for determining whether there were multiple species present in the population. Asymptotic and modified signed-likelihood ratio V equality tests show that V values of anterior-posterior molar length and transverse molar width vary significantly when comparing single species of modern ecological analogs (Muntiacus muntjak, Muntiacus reevesi, and Tragulus javanicus) to groupings of a combined population. However, the V equality tests on dental and postcranial measurements yield almost no significant results when comparing variation in the extinct John Day hypertragulids to an extant population comprised of a single species. Similar comparisons between astragali measurements of hypertragulids and T. javanicus express no significant difference in the level of variation from the combined population to a modern single species. The low level of variation in the hypertragulids and the lack of differentiation between dental characters of individuals does not statistically support the hypothesis that there were multiple species present in the population, suggesting either that cryptic species may be present but impossible to identify without soft tissue remains, or there may have been taxonomic over-splitting of a single hypertragulid species in the John Day region.
Key words: Mammalia, Artiodactyla, Hypertragulidae, morphometrics, dental morphology, astragalus, coefficient of variation, John Day Formation.
Nicholas A. Famoso [nicholas_famoso@nps.gov; ORCID: https://orcid.org/0000-0002-1795-624X ], U.S. National Park Service, John Day Fossil Beds National Monument, 32651 Highway 19, Kimberly, OR, 97848, USA; University of Oregon, Department of Earth Sciences, Cascade Hall, 100, 1272 University of Oregon, Eugene, OR 97403, USA.
Lana K. Jewell [lkj3@pdx.edu; ORDCID: https://orcid.org/0000-0001-9842-1126 ], Department of Geology, Portland State University, 17 Cramer Hall, 1721 SW Broadway, Portland, OR 97201, USA.
Received 8 November 2023, accepted 18 July 2024, published online 25 September 2024.
Copyright © 2024 N.A. Famoso and L.K. Jewell. This is an open-access article distributed under the terms of the Creative Commons Attribution License (for details please see http://creativecommons.org/licenses/by/4.0/), which permits unrestricted use, distribution, and reproduction in any medium, provided the original author and source are credited.
Introduction
Historically, the characteristics which define genera and species within the extinct family Hypertragulidae (order Artiodactyla, class Mammalia) have been difficult to clarify, leading to a muddled assignment of individuals to several of the hypertragulid taxa of the John Day basin (Merriam and Sinclair 1907; Lull 1922; Frick 1937; Scott and Jepsen 1940; Webb and Taylor 1980; Webb 1998; Vislobokova 2001; Métais and Vislobokova 2007). These small, basal ruminant artiodactyls, ranging in size from approximately 1.79–4.35 kg (Evans et al. 2012), are known for their lack of headgear and distinctive tusklike canines, similar to the tragulids (Tragulus spp.), also known as mouse-deer or chevrotains. Hypertragulids likely lived in forested habitats and consumed predominantly browsing diets, eating low leaves and fruits (Métais and Vislobokova 2007) similar to the tragulids, or other modern small ruminants such as muntjacs (Muntiacus spp., Nowak 1991). Carbon isotopic work by Reuter (2021) suggests that Oregon hypertragulids, like other ungulates at the time, were feeding in a mosaic habitat of C3 plants in an open woodland. Paleosol data in at Badlands National Park, South Dakota, USA, shows that hypertragulids lived in savanna woodlands (Wall and Collins 1998). Craniodental measurements of these same Badlands National Park hypertragulids suggest they were mixed feeders in closed habitats (Wall and Collins 1998). Hypertragulids were widespread across North America from the beginning of the Duchesnean (Eocene; ~40.4 Ma) to the late Arikareean (Miocene; ~20.43 Ma) North American Land Mammal Ages (Métais and Vislobokova 2007). Members of the Hypertragulidae include, at minimum, eight species distributed over three genera: Hypertragulus, Nanotragulus, and Hypisodus, but the taxonomic and phylogenetic relationships among many of these taxa remain unclear (Webb and Taylor 1980; Webb 1998; Métais and Vislobokova 2007).
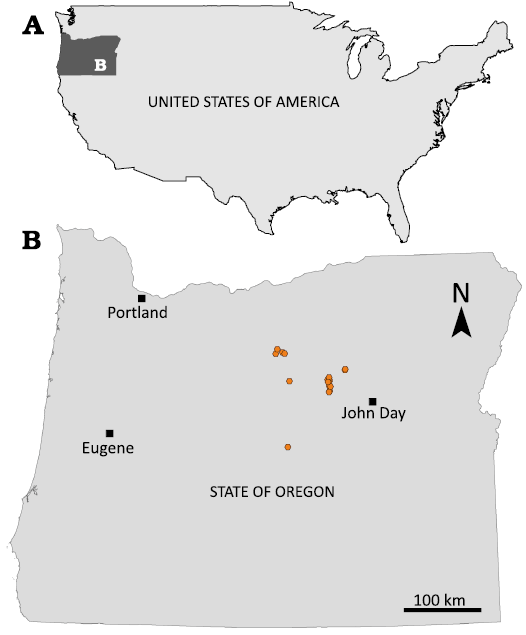
Fig. 1. A. Map showing location of study area in USA. B. Map of Oregon state with John Day localities (orange symbols) where hypertragulid specimens were found.
In the John Day region (Fig. 1), hypertragulid specimens are preserved in the Arikareean age Turtle Cove (~30 to 25.9 Ma), Kimberly (25.9 to 24.8 Ma), and Haystack Valley (24.8 to 23.5 Ma) members of the John Day Formation (Tedford et al. 2004; Hunt and Stepleton 2004; Woodburne 2004; Albright et al. 2008). There have been three species identified to date in the John Day Formation—Hypertragulus hesperius (Hay, 1902), Nanotragulus (= Allomeryx) planiceps (Sinclair, 1905), and Hypertragulus minutus (Lull, 1922). Since the original discovery of these species in the early 20th century, several researchers have attempted to distinguish how the John Day species relate to the rest of the North American hypertragulids. While Sinclair (1905) originally described N. planiceps as the first instance of the genus Allomeryx, Merriam and Sinclair (1907) noted that this species may in fact belong to the genus Hypertragulus. All three species have been evaluated and reevaluated since in multiple discussions of hypertragulid taxonomy (Lull 1922; Frick 1937; Scott and Jepsen 1940; Webb and Taylor 1980; Webb 1998; Vislobokova 2001; Métais and Vislobokova 2007). Most recently, Gardner (2015) attempted to clarify morphometric and phylogenetic distinctions among species in the White River Group of Badlands National Park in South Dakota using a cladistic analysis of individuals. While this work found distinguishable characters between individuals of Hypertragulus minutus and Nanotragulus planiceps, there are no confirmed diagnostic differences between H. hesperius and other species of Hypertragulidae, predominantly because the specimen Lull (1922) suggested as the type of H. hesperius, AMNH 7918, which consists of an articulated skull and jaw cannot be examined in its current state without additional preparation or computed tomography (CT) scanning. Lull (1922) also states that Cope (1884) gave no specific characters other than that H. hesperius is the same size as Hypertragulus calcaratus, but is sometimes larger. Cope also said the two species were indistinguishable to him suggesting the taxa could be the same. Regarding the John Day region, no prior statistical analysis of variation in the population has been performed to determine whether this species diversity is warranted. This lack of previous analyses justifies closely examining the population and statistical variation between species. Any paleoecological or biodiversity studies on the John Day basin would rely on accurate species assignment to specimens, and this work aims to set a foundation for definitive species-level designations of hypertragulid fossils.
One of the most widely used methods for determining species among extinct artiodactyls is examination of the morphology and measurements of dental characters (e.g., Frick 1937; Vislobokova 2001; Janis 1990a; Emery-Wetherell and Davis 2018). Species differentiation in hypertragulids (for many specimens with only dental material available) has been based solely on ranges of tooth length and did not always consider individual variation. While dental measurements may function as a proxy for body size (Fortelius 1990; Janis 1990a), body mass estimation is more accurately applied as an average for an entire fossil species or genus (Scott 1990). These dental measurements would then allow for separation of species based on species for taxa which share otherwise similar craniodental morphology. While regression analyses have shown that the length of individual first and second molars does generally predict body mass, factors such as diet may confound that relationship (Fortelius 1990; Janis 1990a). Qualitative and quantitative dental characters have been used to distinguish species without accounting for molar measurements or body mass, such as morphology of canines and premolars, presence and size of diastemata between premolars, relative hypsodonty of molars, and development and presence of cingula and cingulids (Lull 1922; Frick 1937; Emry 1978; Frailey 1979; Webb and Taylor 1980; Métais and Vislobokova 2007). However, research conducted with modern artiodactyls has called into question the validity of dental characters as a faultless diagnostic technique—populations of artiodactyls experience such uneven wear on their teeth that there is a high level of variation in dental measurements among same-species individuals (Emery-Wetherell and Davis 2018). Some studies of extant small herbivores suggest variation on linear measurements of a single tooth around one millimeter in extant small ruminants (Mennecart et al. 2011) while other studies suggest greater variation (Emery-Wetherell and Davis 2018).
Cranial characters and measurements remain the most reliable diagnostic tool (Pearson 1927) but, the taphonomic processes in the John Day basin destroy all but a handful of cranial specimens, making this method less useful for identification of specimens. Recently, there has been increased interest in the possibility of postcranial characters as a diagnostic tool on fine taxonomic scales (DeGusta and Vrba 2003; Davis and Calède 2012; Davis and McHorse 2013). While this has not been successful in all families, there is potential that linear measurements from astragali, another proxy for body size (Martinez and Sudre 1995; DeGusta and Vrba 2003), could function as another source of diagnostic characters to support the primary analysis of dentition in Hypertragulidae.
We tested whether the dental and postcranial specimens would show enough variation to substantiate the presence of three taxa in the John Day region, namely H. hesperius, H. minutus, and N. planiceps, or whether the level of variation would instead support the existence of fewer taxa. If the variation observed among coeval fossil specimens is higher than that of a single modern species, then we would support the alternate hypothesis of a pooled sample of multiple taxa. We could further refine the number of taxa by testing the variation against that present in groups of related modern taxa. For example, variation among fossil specimens that is not significantly different from that in a group with three related extant taxa would similarly support the presence of three hypertragulid taxa, yet lower variation would only support two taxa present. However, if the variation is lower than we would expect for multiple taxa and was indistinguishable from a single species of modern mouse-deer, then we would support the null hypothesis of one species of hypertragulid in the John Day.
Institutional abbreviations.—AMNH, American Museum of Natural History, New York City, NY, USA; JODA, John Day Fossil Beds National Monument, U.S. National Park Service, Kimberly, OR, USA; MCZ, Museum of Comparative Zoology, Harvard University, Cambridge, MA, USA; UCMP, University of California Museum of Paleontology, Berkeley, CA, USA; YPM, Yale Peabody Museum, Yale University, New Haven, CT, USA.
Other abbreviations.—APL, anterior-posterior length; AT, asymptotic test; MSLRT, modified signed-likelihood ratio test; PCA, principal component analysis; TW, transverse width. We follow standard convention in abbreviating tooth families as I, C, P, and M, with upper and lower case letters referring to upper and lower teeth, respectively.
Material and methods
Material.—We used 340 dental specimens from 136 individual hypertragulids from JODA (Fig. 1). Hypertragulids are the single most abundant mammal fossil in the Oligocene Turtle Cove Member (~30–26 Ma) of the John Day Formation, and with over 1350 cataloged specimens from the John Day basin they are about 40% of the known specimens from the Turtle Cove assemblage at JODA. The majority of the hypertragulid specimens in the JODA collection are teeth, with additional postcranial material and a very limited number of cranial specimens. We limited our analysis to fossils found throughout the stratigraphic (~30–26 Ma) and geographic range of the Turtle Cove Member to analyze a population of relatively coeval individuals (Fig. 1). Additionally, the Turtle Cove Member has a high number of established radiometric dates on six volcanic tuffs thoughtout the section. These, and other tuffs, subdivide the Turtle Cove Member into 14 fossiliferous layers (Albright et al. 2008; Fremd 2010). Not all these tuffs, and subsequently layers, can be found across the entire geographic range of the Turtle Cove Member. These specimens collected before the 1975 establishment of John Day Fossil Beds National Monument do not have refined stratigraphic position identified. To address the lack of lateral continuity of some of the subdivisions, and to allow for the addition of older specimens, including types, we decided to combine all specimens from throughout the Turtle Cove Member into one population. We may expect to see higher variation in this sample as there is a greater likelihood that multiple species may exist over this 4-million-year time range of the Turtle Cove Member. Only molars for which tooth position could be determined were analyzed. Our sample includes maxillae, dentaries, and isolated molars from JODA, as well as the cast of a well-preserved specimen, UCMP 76281 (= JODA 10724). We also included measurements from the cast of the holotype of Allomeryx (= Nanotragulus) planiceps (UCMP 104 = JODA 10842). We took measurements of the Hypertragulus minutus holotype (YPM VP 010545) on a high-quality digital photograph, provided by the Yale Peabody Museum, using ImageJ software (Schneider et al. 2012). No type specimen was originally designated for Hypertragulus hesperius (Hay, 1902), but Lull (1922) states that in a conversation he had with William D. Matthew that AMNH 7918, figured by Cope and Scott (specific references not cited in Lull 1922), is to be regarded as the type, and Lull did include additional characters for the species. AMNH 7918 was not formally designated as a type (Hay 1902) nor a lectotype by Lull (1922), but herein it should be recognized as the lectotype as per ICZN article 74.5. The use of computed tomography (CT) scanning or additional preparation would have been needed to utilize this specimen as it consists of a closed skull and jaw still encased in sediment. We assigned taxonomic identifications based on morphology and size for each hypertragulid dental specimen. We selected 35 complete and 18 partial astragali as a representative sample of postcrania from JODA. This group contained 31 unidentified (21 complete and 10 partial) hypertragulid astragali, 19 H. hesperius (10 complete and 9 partial), two complete H. minutus, and one identified partial N. planiceps astragali. We made these identification of JODA astragali based on relative size, with the smallest being assigned to H. minutus and the largest being assigned to N. planiceps. However, our methodology, both for teeth and astragali, removes the confounding effects of these identifications as it looks at the distribution of data without relying upon these identifications, to determine the number of species present.
To establish a baseline of comparison, we selected three modern comparative taxa to test against our fossil sample. We compared measurements of upper molars to the modern Indian muntjac, Muntiacus muntjak, using published data from Emery-Wetherell and Davis (2018). We compared the lower molars to modern M. muntjak, Muntiacus reevesi (Reeve’s muntjac), and Tragulus javanicus (lesser mouse-deer) using data provided by Christine Janis (Janis 1990a; C. Janis personal communication, 2019). Muntiacus muntjak and M. reevesi are similarly-sized ruminants (Cervidae) with dietary habits analogous to the extinct hypertragulids (Nowak 1991; Janis 1990b) making them appropriate ecomorphs. Tragulus javanicus, from the family Tragulidae and crown Ruminantia, provides another similarly sized and morphologically similar ruminant from a separate genus (Métais and Vislobokova 2007; Mennecart and Métais 2015). While Hypertragulidae is considered stem Ruminantia, it is reasonable to utilize crown taxa from similar morphologies. Additionally, we measured high-quality photographs of eight T. javanicus astragalus specimens from the MCZ Vertebrate Collection using ImageJ.
Dentition morphometrics.—To determine species-level variation in dentition, we measured the APL and TW of both upper and lower molars (Fig. 2). Measurements were recorded for each tooth position in the tooth row (first through third molars). We used a Mitutoyo 4” digital caliper (instrumental error as reported for the device in the unit specification = ± 0.02 mm) and took all measurements in millimeters. We measured APL along the buccal side of upper molars and along the lingual side of lower molars to record maximum length for all teeth. We also took care to consistently measure APL at the enamel-dentine junction to control for variation from wear (Emery-Wetherell and Davis 2018). TW was measured at the maximum width on each individual tooth. All statistical analyses, presented in SOM 1 and 2 (Supplementary Online Material available at http://app.pan.pl/SOM/app69-Famoso_Jewell_SOM.pdf), were conducted in R version 3.6.1 (R Core Team 2019), with the “dplyr” (Version 0.7.8, Wickham et al. 2016), “ggfortify” (Version 0.4.5, Tang et al. 2016), and “plotrix” (Version 3.7.6, Lemon et al. 2019) packages.
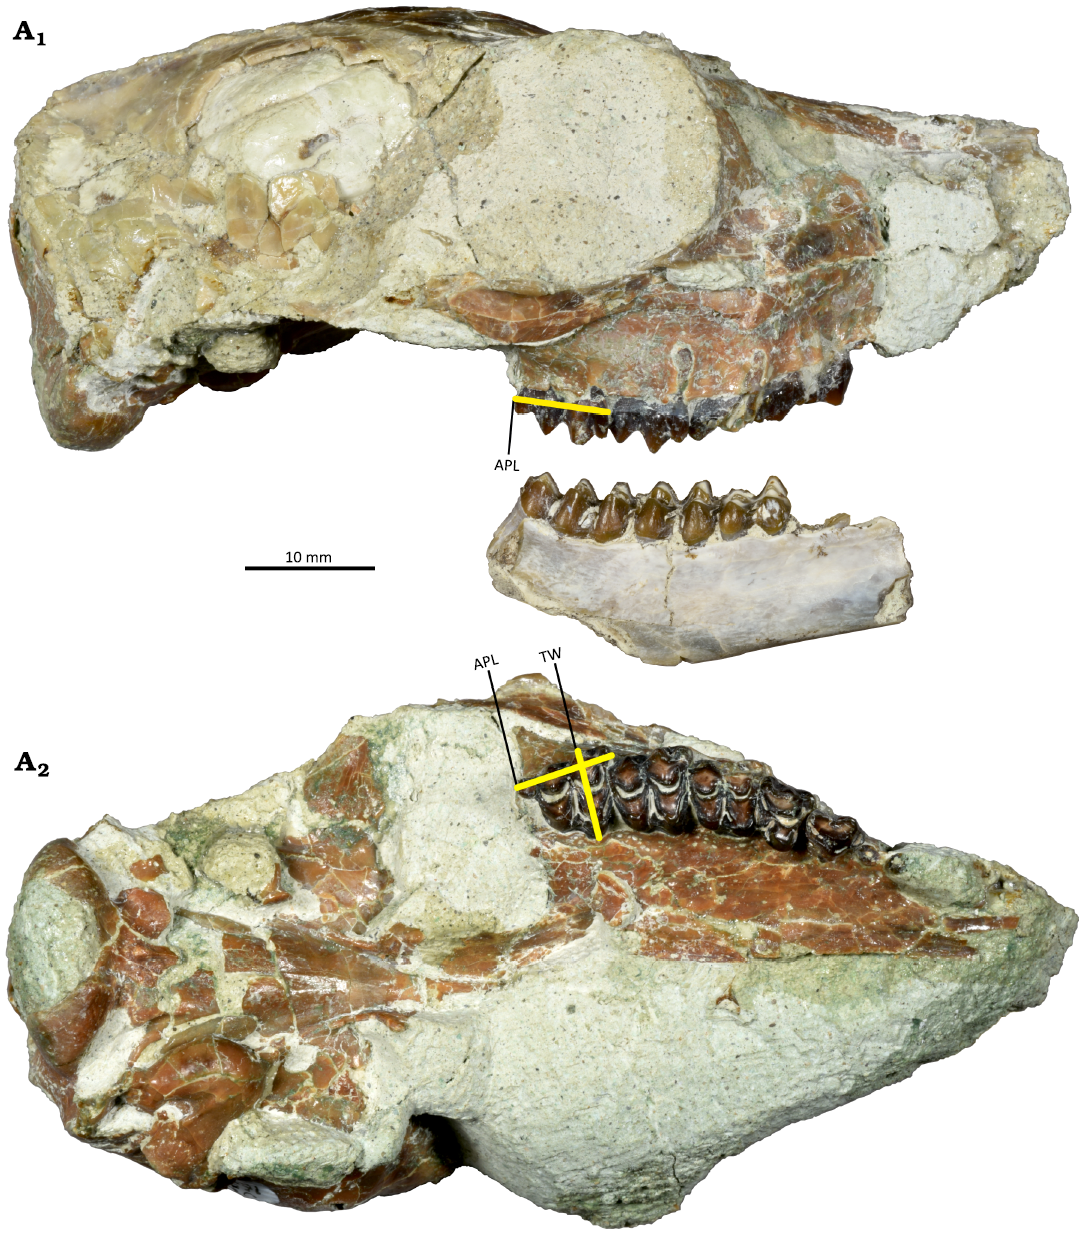
Fig. 2. Anterior-posterior length (APL) and transverse width (TW) measurements, shown on a Hypertragulus hesperius (Hay, 1902) skull and right dentary (JODA 16548) from JDNM-9, Blue Basin, Oligocene. APL taken along the enamel-dentine junction from the right lateral view (A1), APL and TW from the ventral view (A2).
The modern analogs are known to be sexually dimorphic (Janis 1984; Pérez-Barbería et al. 2002), so to test for this potential source of variation, we used methodology similar to Emery-Wetherell and Davis (2018). We conducted a Shapiro-Wilk W test for normality (Shapiro and Wilk 1965), a Hartigan’s dip test for unimodality (Hartigan and Hartigan 1985) using the R package diptest (Version 0.75.7, Maechler 2016), and a finite mixture analysis for multimodality (McLachlan and Peel 2004) using the R package mixtools (Version 1.1.0, Benaglia et al. 2009) to identify the presence or absence of multiple means in the pooled-species sample for dental measurements. These tests are designed to be done on raw measurement and not transformed data (Shapiro and Wilk 1965; Hartigan and Hartigan 1985; Emery-Wetherell and Davis 2018). Additionally, we did not choose to log-transform the data prior to analysis as some datasets were normally distributed, whiles others were not. As such, a log transformation would not be appropriate for all data we used in this analysis. For measurements of modern analogs where one or more of the three tests yielded a significant result, as denoted by a p-value <0.05, a Student’s t-test was conducted between samples of known sex (T. javanicus: male = 5 , female = 3; T. napu: male = 3, female = 3; T. memmina: male = 2, female = 3; M. muntjac: male = 4, female = 4; M. reevesi: male = 4, female = 4) to establish whether the distributions present were attributable to sexual dimorphism or resulted from another source of intraspecific variation (Mallon 2017; Emery-Wetherell and Davis 2018).
Previous work has shown that tooth morphology (e.g., presence, length, width, and enamel complexity) varies with tooth position in ungulates and carnivores (Famoso et al. 2013; Famoso and Davis 2014; Reuter et al. 2021). Emery-Wetherell and Davis (2018) showed that the coefficient of variation throughout the toothrow in artiodactyls, including molar length and width, can vary dramatically necessitating quantification of these variables. Tooth position may be a confounding factor with regards to species differentiation and must be accounted for. To determine if molar morphology differs significantly among species, we would normally use the parametric one-way analysis of variance (ANOVA) and a post-hoc Tukey test (Fisher 1925; Tukey 1949). Given that some of the measurements of the hypertragulid dentition violate the assumptions of parametric tests (normal and unimodal distributions), we conducted a non-parametric Kruskal-Wallis test (Kruskal and Wallis 1952) and a post-hoc Dunn test (R package “dunn.test”, Version 1.3.5; Dunn 1964; Dinno 2017) on both the APL and TW data.
We then calculated the coefficients of variation (V) for the entire fossil sample of hypertragulids by dividing the standard deviation (σ) by the mean (μ). The V describes the variation in a sample as a proportion of the size of that measurement, which is a previously established metric of identifying populations with multiple species present (Pearson 1896; Simpson and Roe 1939; Cope and Lacy 1992; Famoso 2017). For groups with a sample size (n < 5), i.e., all male or female groups of extant taxa and see Table 1 for other small samples, we used the small-sample correction (Sokal and Braumann 1980).
We used both asymptotic (Feltz and Miller 1996) and modified signed-likelihood ratio tests (Krishnamoorthy and Lee 2014) to compare the V values of all analyzed populations with the R package “cvequality” (Version 0.1.3; Marwick and Krishnamoorthy 2019). These tests use μ and σ calculated from raw measurement data to compute and compare V values, generating a test statistic and p-value of significant difference between coefficients of variation. To determine how well the V equality tests can distinguish the ancient and modern populations of basal ruminants, we used these tests to compare molars of modern species amongst each other. We sorted the modern analogs into four groups: one, the total “population” comprised of all three species, another made up of the two species in the genus Muntiacus, and two groups of single-species populations containing M. muntjak and T. javanicus, respectively. We compared these groups to each other, expecting to find the highest variation in the total population, followed by the Muntiacus group, and the lowest level of variation in the individual species. The V values should vary significantly amongst these groups (p <0.05). The subdivisions of the modern taxa would mimic what we expect to see when examining the John Day hypertragulids, thus making them comparable. The resulting p-values from each V equality test (all extant taxa combined, Muntiacus sp. vs. M. muntiacus, Muntiacus sp. vs. T. javanicus, combined hypertragulids, and total hypertragulids vs. M. muntiacus) will indicate if the variation within groups of hypertragulids is significantly different from what is expected for a single-species population, which would then reject the null hypothesis and support the alternative hypotheses that there are multiple species present in the John Day region. If the resulting p-value for the V equality test is not significantly different between the modern analogs and the hypertragulids, then we fail to reject the null hypothesis of only one species.
We also examined qualitative dental characters for patterns that may indicate separate species of hypertragulids, mimicking the original steps of the cladistic analysis of Gardner (2015) and using terminology from Bärmann and Rössner (2011). Forty-seven dental characters, which were used to determine relationships by Gardner (2015), were examined among 42 individuals in the JODA collection. These individuals were selected by (i) completeness of the tooth row, either upper, lower, or both, or (ii) previous identification as belonging to the N. planiceps or H. minutus species groups.
Astragalus morphometrics.—To corroborate the analysis of the dental characters, we collected 8 linear measurements from astragali, as per DeGusta and Vrba (2003) and illustrated in Fig. 3: medial length (LM), intermediate length (LI), lateral length (LL), distal thickness (TD), intermediate thickness (TI), proximal thickness (TP), distal width (WD), and intermediate width (WI). We included specimens with at least five of the eight dimensions in the initial analysis. We then used a PCA, on specimens with all eight dimensions, to determine which of these measurements covary, and select a reduced number of measurements for further analysis (Davis and Calède 2012; Davis and McHorse 2013). Once significant dimensions were determined, we expanded the overall analysis to include more specimens with at least five dimensions. Rather than reducing dimensionality with the PCA to principal components, we considered the amount of covariance of the original measurements with respect to the principal components, and the most distinct measurements were then analyzed further. These primary measurements were assessed for normality and unimodality (as with the dentition) in both the fossil hypertragulid population and the population of modern Tragulus javanicus. Muntjacs were not included in this part of the study as we were unable to access appropriate specimens, because their astragali were either not retained, not identified in museum collections, or not digitally mobilized or otherwise discoverable through museum collection databases. A lack of sex data for the majority of specimens prevents our examination of sexual dimorphism in the modern T. javanicus sample. While there are fewer postcranial specimens of hypertragulids with species-level identification, all of which were found in isolation and not in articulation, we still calculated V values and performed V equality tests between extinct and extant taxa to establish the relative number of species. V values were calculated and compared as previously described, but given lack of data on other modern analogs and limited sample sizes of H. minutus and N. planiceps specimens, the central analysis was conducted by comparison of the entire hypertragulid population to that of the modern T. javanicus specimens. These methods are designed to be done on raw measurement and not transformed data (Davis and Calède 2012; Davis and McHorse 2013).
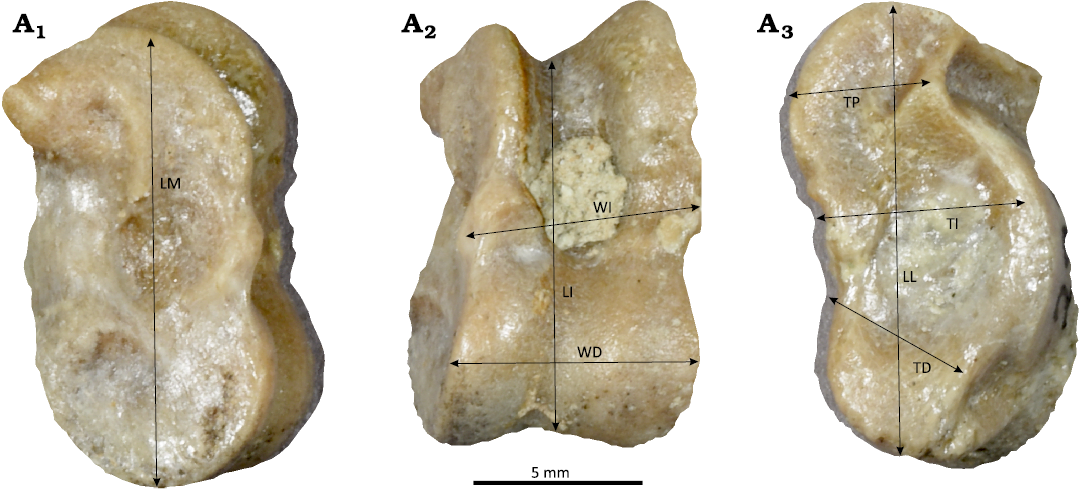
Fig. 3. Photo of hypertragulid astragalus (JODA 2920) from JDNM-9, Blue Basin, Oligocene. A1, the medial view with medial length (LM) measurement; A2, the anterior view, with intermediate length (LI), intermediate width (WI), and distal width (WD) measurements; A3, the lateral view with lateral length (LL), proximal thickness (TP), intermediate thickness (TI), and distal thickness (TD) measurements.
Results
Extant analog dentition.—Both Muntiacus muntjak and Tragulus javanicus exhibited non-normality or multimodality for various tooth positions with no clear association with sex, while all populations of M. reevesi were normally distributed and unimodal. All t-tests conducted between male and female sexes for tooth positions yielded no significant results.
V values calculated for the modern analogs are presented in SOM 3: table 1. The V equality tests, the AT and the MSLRT, both show a significant change in levels of variation of molars when comparing multiple species of ecologic analogs and related taxa together, as presented in Table 1. The difference in variation is significant for both the APL and TW (p <0.0005) when distinguishing between the total population of modern analogs, the population of the Muntiacus species, and a population of only Tragulus specimens for all tooth positions. For V equality tests comparing the pooled sample of the two Muntiacus species to a single species, significance varied widely by tooth position, also in Table 1. The V equality tests for extant taxa are significant for the same measurements when comparing variation in all extant taxa to smaller taxonomic subgroups (genera and species), but are not significant for the same measurements at finer taxonomic scales (comparing species to one another).
Table 1. Resulting p-values from V equality tests for comparative tests between samples. Table includes both asymptotic (AT) and modified signed-likelihood ratio (MSLRT) tests of different groupings of modern analogs, hypertragulids, and a comparison between the total hypertragulid sample and a single modern species. Bold p-value denotes significant difference in V values, where p <0.05. NA, not available.
| |
|
m1APL |
m1TW |
M1APL |
M1TW |
m2APL |
m2TW |
M2APL |
M2TW |
m3APL |
m3TW |
M3APL |
M3TW |
|
All extant taxa combined |
AT |
0.00034 |
0.00001 |
NA |
NA |
0.00052 |
0.00002 |
0.00011 |
0.00606 |
0.00008 |
0.00046 |
NA |
NA |
|
MSLRT |
0.00006 |
0.00000 |
NA |
NA |
0.00004 |
0.00001 |
0.00024 |
0.00537 |
0.00003 |
0.00013 |
NA |
NA |
|
|
Muntiacus sp. vs. M. muntiacus |
AT |
0.15438 |
0.02539 |
NA |
NA |
0.68499 |
0.04824 |
0.77230 |
0.42208 |
0.06226 |
0.16916 |
NA |
NA |
|
MSLRT |
0.11799 |
0.02289 |
NA |
NA |
0.62136 |
0.03350 |
0.75022 |
0.44080 |
0.04641 |
0.14603 |
NA |
NA |
|
|
Muntiacus sp. vs. T. javanicus |
AT |
0.02720 |
0.02526 |
NA |
NA |
0.00849 |
0.11081 |
0.43531 |
0.18038 |
0.08750 |
0.30741 |
NA |
NA |
|
MSLRT |
0.02023 |
0.01880 |
NA |
NA |
0.00403 |
0.09717 |
0.37544 |
0.12628 |
0.06948 |
0.28043 |
NA |
NA |
|
|
Combined |
AT |
0.48979 |
0.25175 |
0.09237 |
0.57854 |
0.04738 |
0.08034 |
0.16060 |
0.08446 |
0.03564 |
0.00012 |
0.07756 |
0.61387 |
|
MSLRT |
0.71469 |
0.10576 |
0.01515 |
0.39931 |
0.03329 |
0.10794 |
0.22087 |
0.01128 |
0.02778 |
0.00003 |
0.04553 |
0.49954 |
|
|
Total hypertragulids vs. |
AT |
0.37293 |
0.09696 |
0.83523 |
0.56344 |
0.02997 |
0.09896 |
0.46571 |
0.13915 |
0.02886 |
0.17266 |
0.70746 |
0.48874 |
|
MSLRT |
0.29008 |
0.07229 |
0.74718 |
0.51039 |
0.10180 |
0.05326 |
0.50373 |
0.18946 |
0.00742 |
0.12977 |
0.63951 |
0.40964 |
Hypertragulid dentition.—The combined hypertragulid sample yielded a significant result for Shapiro-Wilk W tests and finite mixture analyses for the measurements M2 TW, M3 TW, m3 APL, and m3 TW All Hartigan’s dip tests showed non-significant results, which indicate the populations were unimodal. However, in the four cases mentioned previously, this is directly contradicted by the results of the finite mixture analysis. As seen in Fig. 4, the Kruskal-Wallis and post-hoc Dunn tests yielded a lack of significant difference of APL values between upper and lower molars in the first and second tooth positions (m1 to M1: p = 0.1425, m2 to M2: p = 0.3177), while TW measurements were not statistically different between the second and third tooth positions (both upper and lower, M2 to M3: p = 0.3309, m2 to m3: p = 0.6126). Despite the presence of populations which showed non-normal and multimodal distributions, and the similar means of some tooth positions compared to others, all tooth positions were included in this study to gain a comprehensive view of the data.
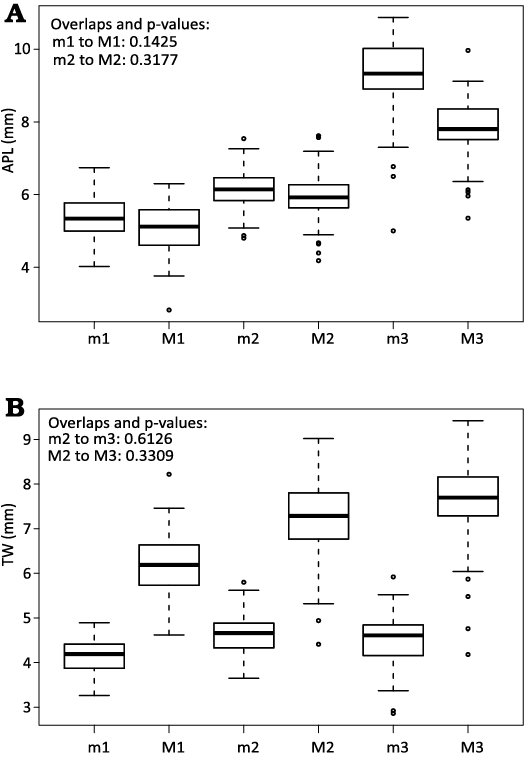
Fig. 4. Boxplots of Kruskal-Wallis test results for anterior-posterior length (APL) (A) and transwerse width (TW) (B) of different tooth positions across all hypertragulids. APL is correlated by position of molar in the jaw, with the upper and lower values for the first and second tooth positions overlapping significantly. TW is similar for lower second and third molars, and similarly overlaps for upper second and third molars.
V values of the tooth positions for the combined Hypertragulidae sample and single-species groups of Hypertragulus hesperius, Hypertragulus minutus, and Nanotragulus planiceps, are presented in SOM 3: table 1. The p-values from the V equality tests comparing the combined hypertragulids to individual species samples are presented in Table 1. Both the AT and the MSLRT showed significant variation between the total sample and the three individual species for the m2 APL and the m3 APL and TW (p <0.05). Additionally, only the MSLRT yielded significant results in two out of twelve cases: M1 APL and M2 TW. All other V equality tests (both AT and MSLRT) for upper and lower molars were not significant when comparing variation from the species groups to the total hypertragulid sample. Figure 5 shows V values for these taxa in addition to V values of the modern analogs presented in SOM 3: table 1.
Tables 1 and 2 also contain V values and associated p-values for V equality tests between molars of both the total hypertragulid sample and the modern M. muntjak sample for all molar positions. For these twelve dimensions, only the m3 APL measurement is significantly different for both tests (AT p = 0.029, MSLRT p = 0.007) and the m2 APL is significantly different for one test (AT p = 0.030, MSLRT p = 0.102).
Twenty-three of the 47 discrete dental characters examined (e.g., presence of a parastyle and entostyle on all upper molars) did not vary among the John Day hypertragulid population. The other 25 did show some variation among individuals, such as the presence of anterior or posterior cingula and cingulids.
Astragali.—Results from the PCA on undamaged hypertragulid astragali, including the eigenvalues and variance explained by each principal component (PC), are presented in Table 2. PC1 is equally negatively correlated with all dimensions, indicating that PC1 is likely representative of overall body size or a similar variable which affects all measurements of the astragali equally.
Table 2. Eigenvalues, variance, and cumulative variation for each principal component (PC) resulting from the principal components analysis (PCA) of undamaged astragali. Most of the variance seen is explained by PC1.
| |
PC1 |
PC2 |
PC3 |
PC4 |
PC5 |
PC6 |
PC7 |
PC8 |
|
Eigenvalues |
6.028052 |
0.6738429 |
0.5143334 |
0.2849161 |
0.2574185 |
0.1305303 |
0.07134444 |
0.03956263 |
|
Variance |
75.351 |
8.423 |
6.429 |
3.561 |
3.218 |
1.632 |
0.892 |
0.495 |
|
Cumulative variance |
75.351 |
83.774 |
90.203 |
93.764 |
96.982 |
98.614 |
99.505 |
100 |
The loading plot of astragalus dimensions in Fig. 6 illustrates a positive correlation between WD and LI; LM, LL, and WI; and TP and TI. TD was not correlated to the WD variable but was positively correlated with all of the others. Variables with small angles on the loading plot are positively correlated, while those with large angles are negatively correlated. Variables at 90-degrees on the loading plot are not correlated. We used this correlation of dimensions to select the four primary dimensions for analysis: LI, WI, TI, and TD. We then added partially damaged astragali to our dataset for which these four dimensions were intact and ran a second PCA to produce an additional loading plot with the full set of specimens, shown in Fig. 7. This plot shows some separation of specimens designated N. planiceps and H. minutus along PC1, but otherwise shows no distinct groupings among the total population or among the undifferentiated hypertragulid specimens.
Table 3 displays V values and p-values of V equality tests for each of the astragali dimensions examined. There is no significant difference in variation for any of the four dimensions between the extinct and extant species, with no p-value for either test below 0.05.
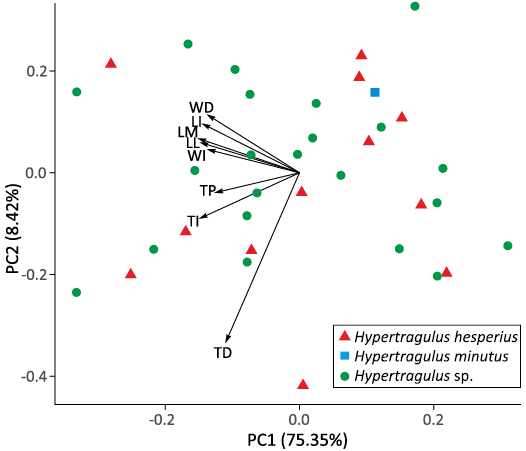
Fig. 6. PCA and loading plot of whole astragali. Different individuals are labeled as points, with the first two principal components as axes. Correlated dimensions are grouped closest together, and unrelated dimensions are at right angles. Abbreviations: LI, intermediate length; LL, lateral length; LM, medial length; TD, distal thickness; TI, intermediate thickness; TP, proximal thickness; WD, distal width; WI, intermediate width.
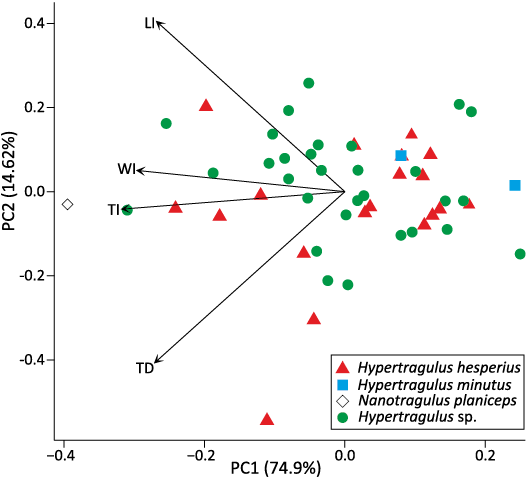
Fig. 7. PCA and loading plot of partial astragali. Different individuals are labeled as points, with the first two principal components as axes. Correlated dimensions are grouped closest together, and unrelated dimensions are at right angles. Abbreviations: LI, intermediate length; TD, distal thickness; TI, intermediate thickness; WI, intermediate width.
Table 3. Mean, standard deviation (SD), number of specimens (n), and V values for selected astragali dimensions of the total hypertragulid population, and the group of modern Tragulus javanicus specimens. Table also includes p-values for symptotic (AT) and modified signed-likelihood ratio (MSLRT) tests between these two populations. Abbreviations: LI, intermediate length; TD, distal thickness; TI, intermediate; WI, intermediate width.
| |
LI |
WI |
TI |
TD |
|
Mean |
11.4644231 |
7.1748077 |
6.5469231 |
5.2275 |
|
Mean T. javanicus |
9.7451429 |
7.442 |
3.5438571 |
5.199 |
|
SD hypertragulids |
1.1022516 |
0.8208424 |
0.636752 |
0.6134725 |
|
SD T. javanicus |
0.7264302 |
0.8296805 |
0.3525339 |
0.4199726 |
|
n hypertragulids |
52 |
52 |
52 |
52 |
|
n T. javanicus |
7 |
7 |
7 |
7 |
|
V hypertragulids |
9.6145401 |
11.4406194 |
9.7259732 |
11.7354857 |
|
V T. javanicus |
7.4542795 |
11.1486222 |
9.9477455 |
8.07795 |
|
AT p-values |
0.4547554 |
0.9340221 |
0.941139 |
0.2971663 |
|
MSLRT p-values |
0.3608325 |
0.7636712 |
0.8369213 |
0.2048561 |
Discussion
Among the twelve dental measurements examined in this study, only two measurements (the m3 APL and m2 APL) showed significantly higher variation in the hypertragulid sample from John Day in comparison to any single modern species. Our examination of modern ruminant dental variation follows an expected progression of increasing V values as the taxonomic group broadened, as seen in both SOM 3: table 1 and Fig. 5. The V equality tests always showed a significant difference between a combined modern sample of three species and any single modern species, but had variable results when tested on finer taxonomic scales (e.g., between a pooled sample of two species of a single genus and either single species). Interestingly, the hypertragulid sample that was thought to contain three separate species of two different genera has a lower V than some individual modern species for several measurements and much lower than the pooled sample of all modern taxa in all measurements (SOM 3: table 1). If the observed pattern in a modern group of three species of two genera holds true (Table 1), the V value of that pooled sample should be greater than that of an individual species, and variation within the total sample should be distinguishable from that of individual species. Instead, the predominantly non-significant variability between the total hypertragulid sample and individual hypertragulid species (Table 1) leaves us unable to reject the null hypothesis that only one species of hypertragulid was present in the John Day basin.
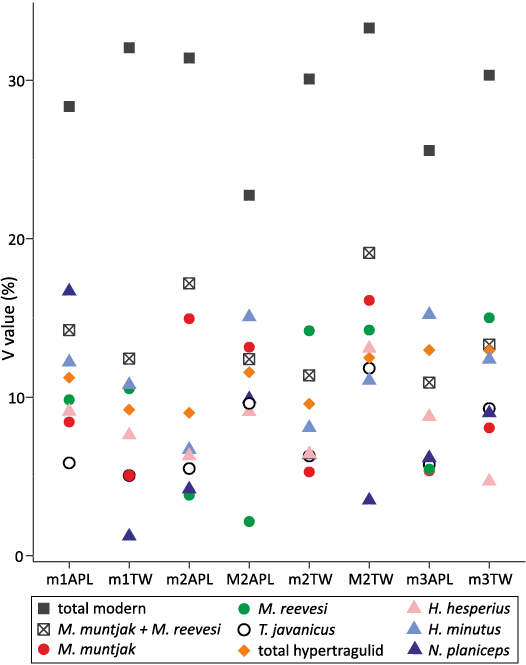
Fig. 5. V values for all molar measurements of all modern analogs, all fossil hypertragulid species, as well as combined populations for comparison. Highest value is for the total modern analog population, while V values for the combined hypertragulid population are generally indistinguishable from V values of a single species.
The lack of statistical difference in variation between astragali of extinct and extant samples further supports our null hypothesis. This lack of difference could simply reflect the limited sample size of identified H. minutus and N. planiceps astragali. The visualizations of the PCA (Figs. 6 and 7) show no clear groupings which would indicate separate species, and rather only show one large group of the combined population. Lack of associated craniodental material with these astragali means that no better designation can be reached at this point for these specimens, and the addition of taxonomically identifiable specimens would be required to strengthen the support for the single-species hypothesis. Given that PC1 explains most of the variation seen in the astragali measurements, we determined that body size is the primary factor influencing astragalar dimensions. Hypertragulids might not be differentiable enough in body size, similar to antilocaprids (Davis and Calède 2012), for the size of astragali to be diagnostic for hypertragulid taxa. A more thorough analysis of astragali in modern small ruminant taxa, similar to the one conducted with dentition in this study, is necessary to determine whether astragalar variability is a reasonable premise to separate these species.
All modern ruminants examined herein do not exhibit quantifiable sexual dimorphism in their molar measurements. We know that these species exhibit sexual dimorphism in body size, and to some extent, tooth size and morphology, especially of the canines (Janis 1984; Pérez-Barbería et al. 2002). That said, Carranza and Pérez-Barbería (2007) found that dentition (with the exception of canines) is uniquely non-differentiable between sexes, likely because larger body size is selected for in males over larger molar size. Another explanation for this may be that tooth size is determined very early in development, long before most size-related secondary sexual characteristics. Body mass differences between sexes arise mostly due to hormonal differences during sexual maturity. Therefore, dental traits might be a better (and not sexually dimorphic) record of “species” body mass. While Kościński and Pietraszewski (2004) were able to use V values to establish sexual dimorphism in unsexed fossil samples, they noted that this is only possible when the V value is ascertained for a group of single sex modern analogs. Our dataset of modern analogs had a within-sex sample size (<7) that was low enough to cause too much skew for this method to be applied. Between this lack of within-sex V values for the modern analogs and the lack of statistical support for dimorphism from t-tests, we conclude that sexual dimorphism does not explain any of the apparent variation in molar measurements observed in their extinct counterparts. However, since astragalar dimensions are a known indicator of body size in artiodactyls (Martinez and Sudre 1995; DeGusta and Vrba 2003; Davis and McHorse 2013) that grow postnatally, future research should still consider the possibility of sexually dimorphic astragalar dimensions.
While the results of our Student’s t-tests do not support sexual dimorphism, various tooth positions did exhibit multimodality or non-normality for two out of the three modern analogs. This points to some other source of intraspecific variation present aside from sexual dimorphism alone. This may be an artifact of small sample size, given that many of the samples were limited to eight individuals. A more sufficient sample size would be around 20 samples (Emery-Wetherell and Davis 2018). Additionally, subspecies may be another explanation for the variation in means, M. muntjak has as many as five named subspecies (Ohtaishi and Gao 1990; Groves and Grubb 1990; Wang and Lan 2000; Grubb and Groves 2011) and T. javanicus has at least two subspecies (Meijaard and Groves 2004) which were not differentiated when constructing the samples for this study. However, this does not explain why M. reevesi, which has at least two subspecies (Ohtaishi and Gao 1990; Groves and Grubb 1990; Gu and Xu 1998) is normally distributed and unimodal. This may also be an instance of a species complex, where multiple cryptic taxa are morphologically indistinguishable but could represent populations incapable of interbreeding. Given the four-million-year timespan over which we are examining variation of hypertragulids, it seems likely that there were separate populations in this location, yet we could not identify a morphological distinction among these taxa. Fossilization removes much of the soft tissue or behavioral characters that allow for distinction of species of extant ruminants. In those species where these features are indistinguishable, such as certain species of muntjaks, DNA testing has revealed cryptic species within these populations, which have then been named as distinct taxa (Grubb and Groves 2011), but this is not possible for separating species in the fossil record. Speciation and shifts in morphology are not necessarily linked (Tattersall and Mowbray 2005), yet without a better basis for differentiation we must proceed with a morphological species concept.
Our brief examination of discrete hypertragulid cheek tooth characters revealed that many were invariant among the John Day hypertragulid population. There were no subsets of dental characters that collectively distinguished any subsets of specimens or species. It may be the case that hypertragulid species are distinguishable only on the basis of premolars, canines, or cranial characters (Emry 1978). However, the H. minutus holotype lacks premolars and the skull entirely, the N. planiceps holotype has damaged premolars and worn occlusal surfaces overall, and the specimen that should be recognized as the lectotype of H. hesperius is not in a state of preparation where the occlusal surfaces of any tooth can be examined. Therefore, distinguishing these three species on the basis of premolar characters would be inconclusive at best. The N. planiceps holotype also best illustrates the difficulties of character examination when confronted with varying levels of wear: cusp patterns and the presence of cingula and cristae appear to vary considerably with wear stage, but a clearer examination of how wear affects hypertragulid dental morphology is needed to draw conclusions about species-diagnostic characters on individuals with worn molars. In addition to the possible confounding factor of wear stage, developmental processes also cause molars to be variable. Lull (1922) noted that plasticity in the species results in increased variability in the morphology of third molars, and the dimensions vary with wear. Multiple studies on mammalian dentition show that ontogeny complicates size, cusp pattern, development of features such as cingula, and more obvious deviations will occur between teeth in individuals and between individuals in species (Butler 1985; Dassule et al. 2000; Asahara et al. 2012). The unpredictable nature of the development of dental characters makes it a tentative method at best for determining relationships between species (Jernvall and Jung 2000; Salazar-Ciudad and Jernvall 2013), and many of the variations in characters we observed could be explained as intraspecific polymorphism. There are other sources of information to diagnose species besides dentition and postcranial characters, most notably qualitative cranial characters (Pearson 1927; Webb and Taylor 1980; Vislobokova 2001; Famoso 2017), but those characters have not yet been described in these taxa. In the absence of morphological differences (either qualitative or quantitative), we consider that taxonomic over-splitting is likely responsible for the discrepancy between the levels of variation seen in this study and the initial description of three species. A normal distribution of variation in the dentition of single-species population can be split arbitrarily, and new species can be designated based on only a small subset of the actual total population. The relative proportion of individuals assigned to H. minutus and N. planiceps, the smaller and largest hypertragulid forms in the John Day region, respectively, points more towards subjective divisions of dental measurements rather than genuine species differences. We show here that there is a lack of statistical support for these designations, thus supporting the hypotheses of a single hypertragulid taxon in the Turtle Cove assemblage.
Conclusions
The lack of significantly higher variation in the quantitative dimensions of the hypertragulid samples from the Turtle Cove Member in comparison to a single modern species difference supports a single species hypothesis. While analogous modern species show 2–15% variation on dental or postcranial measurements in populations of a single species, our entire sample of hypertragulid specimens from the John Day shows only 8–14% variation on the same measurements, a range much lower than would be expected for a group that was previously hypothesized to have three species in two separate genera.
In regard to qualitative characters which might have helped separate species, no conclusive pattern could be identified among individuals, and the unexpected homogeneity of molar morphology precluded any further analysis of specific relationships. While other craniodental characters are worth examining to establish a standard for hypertragulid taxonomy, the characters we examined on the cheek teeth do not appear to be immediately differentiable among species or genera. A standard for hypertragulid taxonomy, perhaps based on a more thorough examination of the type specimens, would be necessary to positively identify individuals to a specific level. We recommend that hypertragulid specimens in the John Day Formation be assigned to Hypertragulus hesperius, as this species was described in 1902 before Hypertragulus minutus and Nanotragulus planiceps (Hay 1902; Sinclair 1905; Lull 1922) and the first to be described in the John Day basin, and therefore has priority over H. minutus and N. planiceps. We believe that formally synonymizing H. hesperius, H. minutes, and N. planiceps would require a more in depth review and include specimens from outside the John Day basin. Although the original description of H. hesperius did not have sufficient detail nor did it designate a type specimen (Hay 1902), subsequent work amended the diagnosis and identified a specimen that should be recognized as the lectotype, although never formally designated (Lull 1922). We herein suggest that AMNH 7918 should be recognized as the lectotype of H. hesperius. While AMNH 7918, which consists of a locked skull and jaw, is unavailable for measurement due to needed preparation, computed tomography (CT) scanning or additional preparation may elucidate data that could help resolve unanswered taxonomic questions in the future.
A single-species designation based on measurements and morphological characters suggests that hypertragulids, and the overall fauna of the Turtle Cove assemblage, were less diverse at this time than previously thought. Methodology from this study could be further applied to hypertragulid specimens in the other members of the John Day Formation to improve our comprehension of the species diversity throughout time in this location. Additionally, a broader taxonomic and phylogenetic analysis incorporating this material from the John Day with other North American hypertragulid populations could better place Hypertragulus hesperius within a greater framework of artiodactyl diversity. However, we have shown that there is little support for three species of hypertragulids in the Turtle Cove assemblage, and that Hypertragulus hesperius is the only one valid, distinct species.
Acknowledgements
We acknowledge that these specimens were found at sites on the traditional territory of the Confederated Tribes of the Umatilla Indian Reservation (Cayuse, Umatilla, and Walla Walla) and on the traditional territory of the Confederated Tribes of Warm Springs (Wasco, Warm Springs, and Paiute) and the Burns Paiute Tribe. We thank the U.S. National Park Service, Washington, D.C., USA and the U.S. Bureau of Land Management, Washington, D.C., USA for providing access to fossil specimens used in this study, as well as Christopher Schierup and Jennifer Cavin (both JODA). We thank Christine Janis (Brown University, Providence, Rhode Island, USA) for providing her dataset of modern artiodactyl tooth measurements. We thank Daniel Brinkman and Jamie Henderson (both YPM) for providing photos of holotypes and the specimen that should be recognized as the lectotype from their vertebrate paleontology collections. Additionally, we thank Mark Omura, Madeleine Mullon, Eva Biedron, and Linda Ford (all MCZ) for assisting with and providing photos of specimens from the vertebrate collections. We thank Ashley Streig (Portland State University, Portland, Oregon, USA) and for her earlier reviews of this manuscript. We thank Samantha Hopkins (University of Oregon, Eugene, Oregon, USA), Barry Albright (University of North Florida, Jacksonville, Florida, USA), and Robert Burrows (University of Chicago, USA) for thoughtful discussions regarding this project, as well as Win McLaughlin (Occidental College, Los Angeles, California, USA). We also thank the editors and Olivier Lambert (Royal Belgian Institute of Natural Sciences, Brussels, Belgium), Edward Byrd Davis (University of Oregon), Bastien Mennecart (Natural History Museum of Basel, Switzerland), Jessica Theodor (University of Calgary, Canada), and Jonathan Marcot (University of California, Los Angeles, USA) for their constructive reviews, feedback, and assistance.
References
Albright III, L.B., Woodburne, M.O., Fremd, T.J., Swisher III, C.C., MacFadden, B.J., and Scott, G.R. 2008. Revised chronostratigraphy and biostratigraphy of the John Day Formation (Turtle Cove and Kimberly Members), Oregon, with implications for updated calibration of the Arikareean North American Land Mammal Age. The Journal of Geology 116: 211–237. Crossref
Asahara, M., Kryukov, A., and Motokawa, M. 2012. Dental anomalies in the Japanese mole Mogera wogura from northeast China and the Primorsky region of Russia. Acta Theriologica 57: 41–48. Crossref
Bärmann, E.V. and Rössner, G.E. 2011. Dental nomenclature in Ruminantia: towards a standard terminological framework. Mammalian Biology 76: 762–768. Crossref
Benaglia, T., Chauveau, D., Hunter, D., and Young, D. 2009. mixtools: Tools for analyzing finite mixture models. R package version 1.1.0 [available online, https://cran.r-project.org/web/packages/mixtools/].
Butler, P.M. 1985. Homologies of molar cusps and crests, and their bearing on assessments of rodent phylogeny. In: W.P. Luckett and J.L. Hartenberger (eds.), Evolutionary Relationships Among Rodents. NATO Advanced Science Institutes (ASI) Series 92: 381–401. Crossref
Carranza, J. and Pérez-Barberia, F.J. 2007. Sexual selection and senescence: male size-dimorphic ungulates evolved relatively smaller molars than females. The American Naturalist 170: 370–380. Crossref
Cope, D.A. and Lacy, M.G. 1992. Falsification of a single species hypothesis using the coefficient of variation: a simulation approach. American Journal of Physical Anthropology 89: 359–378. Crossref
Cope, E.D. 1884. On the structure of the feet in the extinct Artiodactyla of North America. Proceedings of the American Philisophical Society 22 (117): 21–27.
Dassule, H.R., Lewis, P., Bei, M., Maas, R., and McMahon, A.P. 2000. Sonic hedgehog regulates growth and mophogenesis of the tooth. Development 127: 4775–4785. Crossref
Davis, E.B. and Calede, J.J.M. 2012. Extending the utility of artiodactyl postcrania for species-level identifications using multivariate morphometric analyses. Palaeontologia Electronica 15 (1): 1–22. Crossref
Davis, E. and McHorse, B. 2013. A method for improved identification of postcrania from mammalian fossil assemblages: multivariate discriminant function analysis of camelid astragali. Palaeontologia Electronica 16 (3), 1–15. Crossref
DeGusta, D. and Vrba, E. 2003. A method for inferring paleohabitats from the functional morphology of bovid astragali. Journal of Archaeological Science 30: 1009–1022. Crossref
Dinno, A. 2017. dunn.test: Dunn’s test of multiple comparisons using rank sums. R package version 1.3.5 [available online, https://cran.r-project.org/web/packages/dunn.test/index.html].
Dunn, O.J. 1964. Multiple comparisons using rank sums. Technometrics 6: 241–252. Crossref
Emery-Wetherell, M. and Davis, E. 2018. Dental measurements do not diagnose modern artiodactyl species: implications for the systematics of Merycoidodontoidea. Palaeontologia Electronica 21 (2): 1–28. Crossref
Emry, R.J. 1978. A new hypertragulid (Mammalia, Ruminantia) from the early Chadronian of Wyoming and Texas. Journal of Paleontology 52 (5): 1004–1014.
Evans, A.R., Jones, D., Boyer, A.G., Brown, J.H., Costa, D.P., Ernest, S.M., Fitzgerald, E.M., Fortelius, M., Gittleman, J.L., Hamilton, M.J., and Harding, L.E. 2012. The maximum rate of mammal evolution. Proceedings of the National Academy of Sciences 109: 4187–4190. Crossref
Famoso, N.A. 2017. Statistical analysis of dental variation in the Oligocene equid Miohippus (Mammalia, Perissodactyla) of Oregon. Journal of Paleontology 91: 1060–1068. Crossref
Famoso, N.A. and Davis, E.B. 2014. Occlusal Enamel Complexity in Middle Miocene to Holocene Equids (Equidae: Perissodactyla) of North America. PLOS ONE 9 (2): e90184. Crossref
Famoso, N.A., Feranec, R.S., and Davis, E.B. 2013. Occlusal enamel complexity and its implications for lophodonty, hypsodonty, body mass, and diet in extinct and extant ungulates. Palaeogeography, Palaeoclimatology, Palaeoecology 387: 211–216. Crossref
Feltz, C.J. and Miller, G.E. 1996. An asymptotic test for the equality of coefficients of variation from k populations. Statistics in Medicine 15 (6): 647–658.
Fisher, R.A. 1925. Statistical Methods for Research Workers. 239 pp. Oliver and Boyd, Edinburgh.
Fortelius, M. 1990. Problems with using fossil teeth to estimate body sizes of extinct mammals. In: J.D. Damuth and B.J. MacFadden (eds.), Body Size in Mammalian Paleobiology: Estimation and Biological Implications, 207–228. Cambridge University Press, Cambridge.
Frailey, D. 1979. The large mammals of the Buda local fauna (Arikareean: Alachua County, Florida). Bulletin of the Florida State Museum of the Biological Sciences 24: 123–173. Crossref
Fremd, T.J. 2010. Guidebook to the 2010 SVP Field Symposium and John Day Basin Field Conference. 149 pp. Society of Vertebrate Paleontology Guidebook Publications, McLean.
Frick, C. 1937. Horned ruminants of North America. Bulletin of the American Museum of Natural History 69: 1–669.
Gardner, C.K. 2015. Taxonomic Diversity and Interrelationships of the Hypertragulinae Within the Great Plains Regions of North America. 105 pp. South Dakota School of Mines and Technology, Rapid City.
Grubb, C. and Groves, P. 2011. Ungulate Taxonomy. 317 pp. John Hopkins University Press, Baltimore.
Groves, C.P. and Grubb, P. 1990. Muntiacidae. In: G.A. Bubenik and A.B. Bubenik (eds.), Horns, Pronghorns, and Antlers, 134–168. Springer-Verlag, New York. Crossref
Gu, Y.H. and Xu, L.H. 1998. Muntiacus reevesi jiangkouensis—A new subspecies from Guizhou, China (Artiodactyla: Cervidae). Acta Zoologica Sinica 44: 264–270.
Hartigan, J.A. and Hartigan, P.M. 1985. The dip test of unimodality. The Annals of Statistics 13: 70–84. Crossref
Hay, O.P. 1902. Bibliography and catalogue of the fossil Vertebrata of North America. Bulletin of the United States Geological Survey 179: 1–868.
Hunt, R.M. and Stepleton, E. 2004. Geology and paleontology of the upper John Day beds, John Day River Valley, Oregon: lithostratigraphic and biochronologic revision in the Haystack Valley and Kimberly areas (Kimberly and Mt. Misery quadrangles). Bulletin of the American Museum of Natural History 282: 1–90. Crossref
Janis, C. 1984. Tragulids as living fossils. In: N. Eldredge and S.M. Stanley (eds.), Living Fossils, 87–94. Springer-Verlag, New York. Crossref
Janis, C.M. 1990a. Variables with body size in ungulates and macropodoids. In: J.D. Damuth and B.J. MacFadden (eds.), Body Size in Mammalian Paleobiology: Estimation and Biological Implications, 255–299. Cambridge University Press, Cambridge.
Janis, C.M. 1990b. Correlation of cranial and dental variables with dietary preferences in mammals: a comparison of macropodoids and ungulates. Memoirs of the Queensland Museum 28 (1): 349–366.
Jernvall, J. and Jung, H.S. 2000. Genotype, phenotype, and developmental biology of molar tooth characters. American Journal of Biological Anthropology 113 (S31): 171–190. Crossref
Kościński, K. and Pietraszewski, S. 2004. Methods to estimate sexual dimorphism from unsexed samples: a test with computer-generated samples. Przegląd Antropologiczny-Anthropological Review 67: 33–55.
Krishnamoorthy, K. and Lee, M. 2014. Improved tests for the equality of normal coefficients of variation. Computational Statistics 29 (1–2): 215–232. Crossref
Kruskal, W.H. and Wallis, W.A. 1952. Use of ranks in one-criterion variance analysis. Journal of the American Statistical Association 47 (260): 583–621. Crossref
Lemon, J., Bolker, B., Oom, S., Klein, E., Rowlingson, B., Wickham, H., Tyagi, A., Eterradossi, O., Grothendieck, G., Toews, M. and others. 2019. plotrix: Various plotting functions. R package version 3.7.6 [available online, https://cran.r-project.org/web/packages/plotrix/].
Lull, R.S. 1922. Primitive Pecora in Yale Museum. American Journal of Science 4 (20): 111–119. Crossref
Maechler, M. 2015. dip.test: Hartigan’s dip test statistic for unimodality—corrected. R package version 0.75-7 [available online, https://cran.r-project.org/web/packages/diptest/index.html].
Mallon, J.C. 2017. Recognizing sexual dimorphism in the fossil record: lessons from nonavian dinosaurs. Paleobiology 43 (3): 495–507. Crossref
Martinez, J.N. and Sudre, J. 1995. The astragalus of Paleogene artiodactyls: comparative morphology, variability and prediction of body mass. Lethaia 28: 197–209. Crossref
Marwick, B. and Krishnamoorthy, K. 2019. cvequality: Tests for the equality of coefficients of variation from multiple groups. R package version 0.1.3 [available online, https://cran.r-project.org/web/packages/cvequality/index.html].
McLachlan, G.J. and Peel, D. 2004. Finite Mixture Models. 464 pp. John Wiley & Sons, Hoboken.
Meijaard, E. and Groves, C.P. 2004. A taxonomic revision of the Tragulus mouse-deer (Artiodactyla). Zoological Journal of the Linnean Society 140: 63–102. Crossref
Mennecart, B. and Métais, G. 2015. Mosaicomeryx gen. nov., a ruminant mammal from the Oligocene of Europe and the significance of “gelocids”. Journal of Systematic Palaeontology 13: 581–600. Crossref
Mennecart, B., Becker, D., and Berger, J.-P. 2011. Iberomeryx minor (Mammalia, Artiodactyla) from the Early Oligocene of Soulce (Canton Jura, NW Switzerland): systematics and palaeodiet. Swiss Journal of Geosciences 104 (Supplement 1): S115–S132. Crossref
Merriam, J.C. and Sinclair, W.J. 1907. Tertiary faunas of the John Day region. University of California Publications,Bulletin of the Department of Geological Sciences 5 (11):171–205.
Métais, G. and Vislobokova, I. 2007. Basal ruminants. In: D.R. Prothero and S.E. Foss (eds.), The Evolution of Artiodactyls, 189–212. John Hopkins University Press, Baltimore.
Nowak, R.M. 1991. Walker’s Mammals of the World, Vol. 2, 5th ed., i–xiii + 643–1629 pp. Johns Hopkins University Press, Baltimore.
Ohtaishi, N. and Gao, Y. 1990. A review of the distribution of all species of deer (Tragulidae, Moschidae and Cervidae) in China. Mammal Review 20: 125–144. Crossref
Pearson, H.S. 1927. IX. On the skulls of early tertiary suidæ, together with an account of the otic region in some other primitive artiodactyla. Philosophical Transactions of the Royal Society of London. Series B, Containing Papers of a Biological Character 215 (421–430): 389–460. Crossref
Pearson, K. 1896. VII. Mathematical contributions to the theory of evolution.—III. Regression, heredity, and panmixia. Philosophical Transactions of the Royal Society of London. Series A, Containing Papers of a Mathematical or Physical Character 187: 253–318. Crossref
Pérez-Barberia, F.J., Gordon, I.J., and Pagel, M. 2002. The origins of sexual dimorphism in body size in ungulates. Evolution 56: 1276–1285. Crossref
R Core Team and others. 2013. R: A language and environment for statistical computing. R software version 3.6.1.
Reuter, D.M. 2021. Trophic Structure Evolution in Oregon Oligo-Miocene Terrestrial Communities. 163 pp. University of Oregon. Eugene.
Reuter, D.M., Hopkins, S.S.B., and Davis, E.B. 2021. Carnivoran intraspecific tooth-size variation shows heterogeneity along the tooth row and among species. Journal of Mammalogy 102: 236–249. Crossref
Salazar-Ciudad, I. and Jernvall, J. 2013. The causality horizon and the developmental bases of morphological evolution. Biological Theory 8: 286–292. Crossref
Schneider, C.A., Rasband, W.S., and Eliceiri, K.W. 2012. NIH Image to ImageJ: 25 years of image analysis. Nature Methods 9: 671–675. Crossref
Scott, K.M. 1990. Postcranial dimensions of ungulates as predictors of body mass. In: J.D. Damuth and B.J. MacFadden (eds.), Body Size in Mammalian Paleobiology: Estimation and Biological Implications, 301–335. Cambridge University Press, Cambridge.
Scott, W.B. and Jepsen, G.L. 1940. The mammalian fauna of the White River Oligocene: Part IV. Artiodactyla. Transactions of the American Philosophical Society 28: 363–746. Crossref
Shapiro, S.S. and Wilk, M.B. 1965. An analysis of variance test for normality (complete samples). Biometrika 52: 591–611. Crossref
Simpson, G.G. and Roe, A. 1939. Quantitative Zoology: Numerical Concepts and Methods in the Study of Recent and Fossil Animals. 373 pp. McGraw-Hill, New York. Crossref
Sinclair, W.J. 1905. New or imperfectly known rodents and ungulates from the John Day Series. University of California Publications, Bulletin of the Department of Geological Sciences 4 (6): 125–143.
Sokal, R.R. and Braumann, C.A. 1980. Significance tests for coefficients of variation and variability profiles. Systematic Biology 29: 50–66. Crossref
Tang, Y., Horikoshi, M., and Li, W. 2016. ggfortify: Data visualization tools for statistical analysis results. R package version 0.4.5 [available online, https://cran.r-project.org/web/packages/ggfortify/index.html]. Crossref
Tattersall, I. and Mowbray, K. 2005. Species and paleoanthropology. Theory in Biosciences 123: 371–379. Crossref
Tedford, R.H., Albright III, L.B., Barnosky, A.D., Ferrusquia-Villafranca, I., Hunt, R.M., Jr., Storer, J.E., Swisher III, C.C., Voorhies, M.R., Webb, S.D., and Whistler, D.P. 2004. Mammalian biochronology of the Arikareean through Hemphillian interval (late Oligocene through early Pliocene epochs). In: M.O. Woodburne (ed.), Late Cretaceous and Cenozoic Mammals of North America: Biostratigraphy and Geochronology, 169–231. Columbia University Press, New York. Crossref
Tukey, J.W. 1949. Comparing individual means in the analysis of variance. Biometrics 5 (2): 99–114. Crossref
Vislobokova, I.A. 2001. Evolution and classification of tragulina (Ruminantia, Artiodactyla). Paleontological Journal 35 (2): S69–S145.
Wall, W.P. and Collins, C. 1998. A comparison of feeding adaptations in two primitive ruminant, Hypertragulus and Leptomeryx, from the Oligocene deposits of Badlands National Park. National Park Service Paleontological Research 3: 13–17.
Wang, W. and Lan, H. 2000. Rapid and parallel chromosomal number reductions in muntjac deer inferred from mitochondrial DNA phylogeny. Molecular Biology and Evolution 17: 1326–1333. Crossref
Webb, S.D. 1998. Hornless ruminants. In: C.M. Janis, K.M. Scott, and L.L. Jacobs (eds.), Evolution of Tertiary Mammals of North America: Volume 1, Terrestrial Carnivores, Ungulates, and Ungulate Like Mammals, 463–476. Cambridge University Press, Cambridge. Crossref
Webb, S.D. and Taylor, B.E. 1980. The phylogeny of hornless ruminants and a description of the cranium of Archaeomeryx. Bulletin of the American Museum of Natural History 167 (3): 121–157.
Wickham, H., Francois, R., Henry, L., and Müller, K. 2015. dplyr: A grammar of data manipulation. R package version 0.4.3 [available online, https://cran.r-project.org/web/packages/dplyr/index.html]. Crossref
Woodburne, M.O. 2004. Global events and the North American mammalian biochronology. In: M.O. Woodburne (ed.), Late Cretaceous and Cenozoic Mammals of North America: Biostratigraphy and Geochronology, 315–343. Columbia University Press, New York. Crossref
Acta Palaeontol. Pol. 69 (3): 411–423, 2024
https://doi.org/10.4202/app.01119.2023