
Convergent allometric trajectories in Devonian–Carboniferous unornamented Polygnathus conodonts
FÉLIX NESME, CATHERINE GIRARD, CARLO CORRADINI, and SABRINA RENAUD
Nesme, F., Girard, C., Corradini, C., and Renaud, S. 2025. Convergent allometric trajectories in Devonian–Carboniferous unornamented Polygnathus conodonts. Acta Palaeontologica Polonica 70 (1): 25–41.
The shape of feeding structures is reputed to be under functional constraints related to the processing of food particles. Their morphological variation through evolution and ontogeny may thus provide an insight into changes in occlusal dynamics and diet. The present study therefore aims at characterizing allometric trajectories of oral elements of Polygnathus conodonts, with a focus on caudal P1 elements that functioned in occlusion like mammalian molars. The shape of the elements, collected at the Puech de la Suque section, France, ranging from the uppermost Devonian to the lowermost Carboniferous, was quantified using a three-dimensional morphometric geometric approach, focusing on the most abundant unornamented conodonts. Polygnathus elements varied in size and shape along the record, leading to the definition of four successive Operational Taxonomic Units (OTUs). The pattern of bilateral asymmetry remained stable across these OTUs. In contrast, allometric trajectories displayed several reorientations, due to different juvenile morphologies but similar adult shapes. Both within and across OTUs, small-sized unornamented Polygnathus elements displayed a higher disparity than large-sized ones, suggesting higher constraints on the morphology of the later. These findings suggest that the constraints on adult Polygnathus remained important but relatively stable over time, leading to a convergence toward a common adult morphology despite initial morphological differences.
Key words: Conodonta, geometric morphometrics, occlusion, bilateral asymmetry, Devonian, Carboniferous, France.
Félix Nesme [felix.nesme@umontpellier.fr; ORCID: https://orcid.org/0009-0001-2489-7647 ], and Catherine Girard [catherine.girard@umontpellier.fr; ORCID: https://orcid.org/0000-0003-3123-8276 ], ISEM, Université de Montpellier, CNRS, EPHE, IRD, Montpellier, France.
Carlo Corradini [ccorradini@units.it; ORCID: https://orcid.org/0000-0002-5153-7612 ], Università degli Studi di Trieste, Dipartimento di Matematica, Informatica e Geoscienze, via Weiss 2, 34128 Trieste, Italy.
Sabrina Renaud [sabrina.renaud@univ-lyon1.fr; ORCID: https://orcid.org/0000-0002-8730-3113 ], Laboratoire de Biométrie et Biologie Evolutive, UMR 5558 CNRS, Université Claude Bernard Lyon1, Campus de la Doua, Bâtiment Mendel, 2 rue Dubois, 69100 Villeurbanne, France.
Received 31 July 2024, accepted 8 January 2025, published online 4 March 2025.
Copyright © 2025 F. Nesme et al. This is an open-access article distributed under the terms of the Creative Commons Attribution License (for details please see http://creativecommons.org/licenses/by/4.0/), which permits unrestricted use, distribution, and reproduction in any medium, provided the original author and source are credited.
Introduction
Convergence refers to the repeated evolution of similar phenotypes acquired independently in response to comparable environmental and/or ecological conditions, in contrast to parallel evolution, which occurs when similar phenotypes are inherited from a common ancestor. It constitutes a strong evidence for the adaptive significance of the trait involved (Harmon et al. 2005), being interpreted as the signature of strong functional constraints around an adaptive optimum. Convergent evolution may be facilitated when the target phenotype is already present as standing variation in a population. Main directions of intra-population variance have therefore been suggested to constitute “lines of least resistance” to evolution (Schluter 1996), related to underlying genetic structure and developmental constraints (e.g., Hayden et al. 2020). These “lines of least resistance” to evolution can channel phenotypic evolution along preferred trajectories and favour recurrent evolution (Hunt 2007; Renaud and Auffray 2013). The study of the relationship between intra-population variance and patterns of recurrent evolution is therefore a way to get insight into the processes favouring or constraining response to selection.
Conodonts were eel-shaped marine animals that existed between the late Cambrian and the Early Jurassic (Briggs et al. 1983; Du et al. 2023). They are affiliated to vertebrates but lack any modern relatives (Aldridge et al. 1993). They displayed a complex feeding apparatus, with rostral elements forming a structure to trap food while more robust caudal elements processed the food (Aldridge et al. 1987; Purnell and Donoghue 1997; Corradini et al. 2024). These micrometric elements were composed of phosphate and were the only mineralized tissues of conodont animal. Therefore, they constitute the vast majority of the fossil remains of these animals (Sweet 1988; Donoghue et al. 2000, 2008). These elements are abundant in many Palaeozoic marine deposits, allowing for quantitative analyses of extensive fossil records providing insights into their paleobiology and evolution (Sweet 1988; Renaud and Girard 1999; Donoghue et al. 2000, 2008; Girard and Renaud 2012; Guenser et al. 2019; Girard et al. 2022).
Such a complex oral apparatus allowed conodonts to feed as first level consumers (Balter et al. 2019). The most caudal elements of the apparatus, termed P1, certainly functioned in occlusion, like mammalian molars (Donoghue and Purnell 1999). Their morphology was therefore most certainly shaped by functional constraints related to the pattern of occlusion (e.g., Assemat et al. 2023; Kelz et al. 2023).
Other sources of morphological variation, however, potentially interfered with this ecomorphological signature. The buccal elements grew throughout the animal’s life by accretion of successive lamellae, a process probably made possible by the alternation of periods of eruption and growth (Jeppsson 1979; Donoghue and Purnell 1999; Shirley et al. 2018). As a consequence, the elements grew in size along the animal’s life and displayed an important allometric variation (Chen et al. 2016; Kelz et al. 2023). The occlusion of caudal elements occurred between paired sinistral and dextral elements, leading to a possible role of bilateral asymmetry in the feeding functioning (Renaud et al. 2021b).
Among the diversity of conodonts, the genus Polygnathus constitutes a long-lived taxon (around 60 million of years, covering almost entire Devonian and a part of the Carboniferous) in which the P1 element recurrently evolved a dorsal platform from an ancestral blade-like condition (Yolkin et al. 1994; Mawson 1998; Martinez-Perez et al. 2016). Morphofunctional analyses showed that the platform in Polygnathus allowed the accommodation and dissipation of the stress related to the tooth-like function, suggesting that this recurrent evolution constituted an example of convergent evolution in response to recurrent functional selective pressures (Martinez-Perez et al. 2016). How this convergent evolution was conditioned by constraints related to allometry and asymmetry across taxonomic diversity and over time remains, however, largely unknown. Based on a study of Famennian Polygnathus, it was suggested that constraints related to occlusion were less important in small-sized elements, leading to different allometric trajectories in different Famennian species (Renaud et al. 2021b). Constraints related to pairing of opposite elements, controlling the pattern of bilateral asymmetry, seemed in contrast relatively conserved throughout the evolution of the genus (Martinez-Perez et al. 2016).
The present study therefore aimed at quantifying the shape of Polygnathus P1 elements along roughly three million years record ranging from the Late Devonian to the early Carboniferous (Aretz et al. 2020). It therefore encompasses the Hangenberg event, marked by one of the most important extinction phases of the Palaeozoic (Kaiser et al. 2016). Along this record, the three-dimensional morphology of the Polygnathus P1 elements was quantified using a landmark-based geometric morphometric approach, in order to characterize patterns of allometric variation, bilateral asymmetry, and evolution through the record. The study was focused on unornamented Polygnathus P1 elements, the ornamented forms being rare in the investigated section.
Beyond the quantification of morphological variation and its relationship with the taxonomic diversity, expectations were the following: (i) if constraints related to occlusion are indeed low in small-sized Polygnathus and higher in large-sized ones, allometric trajectories may vary along time, but they should converge towards similar adult shapes, leading to a decreased morphological disparity in large-sized classes; (ii) general patterns of bilateral asymmetry, characterizing dextral/sinistral differences, if involved in stabilizing occlusion, should be conserved across populations over time; (iii) patterns of size evolution, for instance following the Hangenberg crisis, may influence shape evolution by modulating the allometric trajectories and the frequency of large-sized, adult shaped Polygnathus. Altogether, these processes are candidates to channel the evolution of unornamented Polygnathus towards convergent morphologies.
Institutional abbreviations.—ISEM, Institut des Sciences de l’Evolution de Montpellier, France; CNRS, Centre National de la Recherche Scientifique, France; UMR, Unité Mixte de Recherche, France; IRD, Institut de Recherche pour le Développement, France; EPHE, École Pratique des Hautes Etudes, France.
Other abbreviations.—ALPACA, Automated Landmarking through Pointcloud Alignment and Correspondence Analysis; ANOVA, Analyses of Variance; CSize, Centroid Size; CVA, Canonical Variance Analysis; GPA, Generalized Procrustes Analysis; OTU, Operational Taxonomic Unit; P Length, Platform Length; PC, Principal Component; PCA, Principal Component Analysis; PS, Puech de la Suque.
Geological setting
Samples have been collected at the Puech de la Suque section, Montagne Noire, France (Fig. 1A). This section is characterized by a reverted stratigraphy with a very low grade metamorphism (Girard 1994). The record, spreading over 7.5 m of limestone, documents the last million years of the Devonian and the first five million years of the Carboniferous (Aretz et al. 2020). Sedimentation occurred in a calm offshore environment (Feist et al. 2020). The younger Devonian rocks are marked by a 0.26 m thick layer of dark shales, interpreted as deposited during the Hangenberg event. Ten stratigraphic levels were selected along the section, documenting the uppermost Famennian (Devonian) and the lowermost Tournaisian (Carboniferous) (Fig. 1B). The first sample (PS90) is uppermost Devonian (upper part of the Bispathodus ultimus Zone) and directly underlays the shales representing the Hangenberg event. The nine Tournaisian stratigraphic levels range from the upper part of the Protognathodus kockeli Zone (Siphonodella sulcata Conodont Zone) to the Siphonodella sandbergi Zone (Fig. 1B).
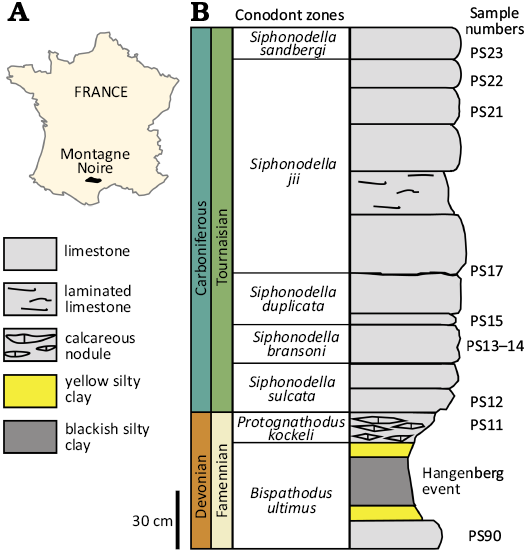
Fig. 1. Sampling of the study at the Puech de la Suque section (Montagne Noire). A. Map of France showing the location of the Montagne Noire (France). B. Stratigraphic log showing the sampled levels. The levels are coloured according to their Operational Taxonomic Unit (OTU). Modified after Girard (1994) and Feist et al. (2020). Conodont zones from Becker et al. (2016) and Corradini et al. (2017).
Material and methods
Conodont sampling.—Rock material was dissolved during 24 hours using diluted formic acid (10%) and rinsed through a 100 μm sieve. Conodont elements were manually picked from residual fraction using a Nikon stereomicroscope. All Polygnathus P1 elements were collected but only the elements without damage were retained. The study was focused on the unornamented Polygnathus (Po.) conodonts, encompassing the taxonomic species Po. communis and Po. purus, which were by far dominant in the record compared to ornamented elements of the Po. inornatus group (Po. inornatus, Po. longiposticus, and Po. symmetricus), representing less than 5% of the assemblages at the Puech de La Suque section.
Description of P1 morphology and sampling.—P1 elements were located in the pharyngeal region, at the rear of the apparatus (Aldridge et al. 1995). They were arranged as a pair of sinistral and dextral elements. Each P1 element is composed of a platform and a free blade part (Fig. 2) joining at the insertion points. The free blade is composed of an alignment of denticles and is prolonged through the platform by the carina. The edges of the platform are called “margins”. On the aboral side, given the standard orientation (Purnell et al. 2000), a ridge (the “keel”) extends along most of the platform, stretching along two-third of the platform length unto the dorsal tip. The aboral side of the platform is marked by a basal cavity below the keel; its deepest point is called the “pit”. The platform is located dorsally and the free blade ventrally. The curvature of the blade, including carina and free blade, characterizes the side of the elements: a curvature to the left in oral view defines sinistral elements (sensu Purnell et al. 2000).
In some elements, an aboral depression can be observed, located dorsally to the basal cavity. The presence of this depression has been proposed as a diagnostic character for the genus Neopolygnathus (Barskov et al. 1991; Vorontsova 1996), therefore splitting Polygnathus sensu lato into Polygnathus sensu stricto and Neopolygnathus. The relevance of this new genus is disputed, but the presence or absence of aboral depression also defines the two dominant stratigraphic species in the Puech de la Suque section (Feist et al. 2020), Polygnathus communis being characterized by a depression and Polygnathus purus being devoid of depression. The status of these two taxonomic species is debated. Their unornamented oral morphology is very similar and they have been proposed to have an ancestor-descendant relationship (Ji 1989; Dzik 1997). Unornamented specimens with and without depression were therefore pooled in the analyses, but to investigate the pertinence of this criterion as a diagnostic character, the presence or absence of the aboral depression was reported. The numbers of Polygnathus (sensu lato) P1 element included in the analysis are provided in Table 1.
Table 1. Sample size of Polygnathus P1 elements within levels, detailed according to their Operational Taxonomic Unit (OTU), the presence/absence of an aboral depression and the dextral/sinistral side.
|
Levels |
OTU |
Counts |
Percentages |
||||
|
depression |
no depression |
dextral |
depression |
||||
|
dextral |
sinistral |
dextral |
sinistral |
||||
|
PS23 |
4 |
18 |
27 |
12 |
8 |
46.3 |
69.2 |
|
PS22 |
4 |
24 |
32 |
8 |
12 |
42.1 |
73.7 |
|
PS21 |
4 |
15 |
20 |
6 |
8 |
42.9 |
71.4 |
|
PS17 |
3 |
2 |
2 |
9 |
12 |
44.0 |
16.0 |
|
PS15 |
3 |
2 |
0 |
32 |
23 |
59.7 |
3.5 |
|
PS14 |
3 |
1 |
2 |
27 |
23 |
52.8 |
5.7 |
|
PS13 |
3 |
5 |
2 |
17 |
23 |
46.8 |
14.9 |
|
PS12 |
2 |
4 |
3 |
5 |
4 |
56.3 |
43.8 |
|
PS11 |
2 |
6 |
16 |
4 |
5 |
32.3 |
70.8 |
|
PS90 |
1 |
11 |
10 |
1 |
0 |
54.6 |
95.5 |
Acquisition of 3D surfaces.—Polygnathus P1 elements were glued onto a toothpick and scanned at a cubic voxel resolution of 1.4 µm using the Phoenix Nanotom S microtomograph on the AniRA-ImmOs platform of the SFR Biosciences, Ecole Normale Supérieure, Lyon, France. The scanning parameters were as follows: 100 kV, 70 lA, 3000 projections at 360° with no filter. Surfaces were segmented with the Avizo software (v. 9.1; Visualization Science Group, FEI Company). 3D surfaces of the dextral elements were subjected to a mirror transformation and measured as sinistral elements. A selection of illustrative surfaces is available at MorphoMuseuM (Nesme et al. 2025).
Morphometric descriptors.—A set of 45 landmarks and semi-landmarks has been used to describe the morphology of the P1 element, including platform and carina but not the free blade that is too often damaged (Fig. 2). This set includes the same landmarks as in a previous study (Renaud et al. 2021b): (i) four landmarks positioned on the rostral insertion point (i.e., the location where the margin meets the free blade), the dorsal tip, the caudal insertion point, and the median point located on the carina between the insertion points; (ii) two sets of 13 semi-landmarks placed at regular intervals along the edge of the rostral and caudal margins, each being anchored by the dorsal tip and the corresponding insertion point; (iii) a set of 7 semi-landmarks describing the carina on the oral side. These semi-landmarks were located in valleys between the denticles to minimize the impact of possible breakage of the tip of the denticles. This series of semi-landmarks was anchored by the landmark at the dorsal tip of the platform, and an additional landmark located in the closest valley of the carina between the two insertion points; this previously described set of landmarks and semi-landmarks has been complemented by 7 semi-landmarks located at regular intervals along the keel on the aboral side, anchored by a fifth landmark positioned at the pit of the basal cavity.
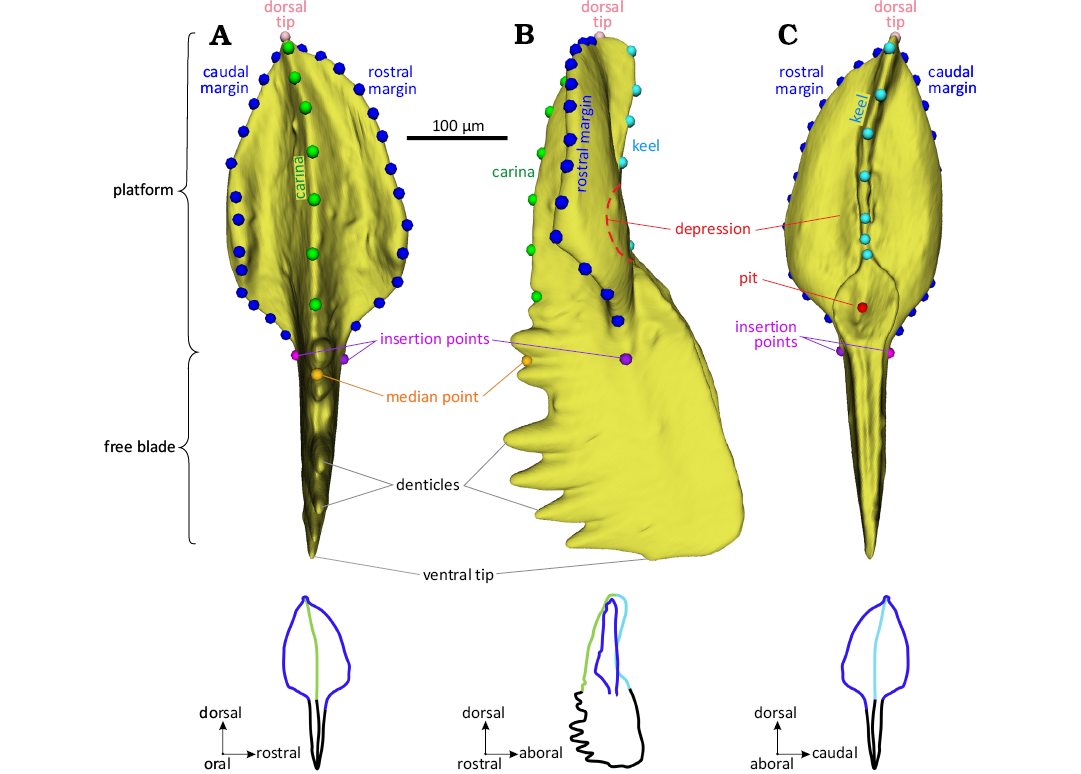
Fig. 2. Location of the 3D landmarks and morphological terms annotated on a sinistral Polygnathus P1 element. A. Oral (upper) view. B. Rostral (profile) view. C. Aboral (lower) view. Dots represent the landmarks and sliding semi-landmarks. Magenta: landmarks at the insertion points. Pink: landmark of the dorsal tip. Red: landmark of the pit. Orange: landmark at the start of the carina. Dark blue: semi-landmarks along the margins. Green: semi-landmarks on the carina. Light blue: semi-landmarks on the keel. Illustrated specimen: element UM PSQ 010, from the Devonian level PS90 of the Puech de la Suque section.
Each specimen was thus described by the x, y, z coordinates of these 45 (semi-)landmarks.
In order to collect these coordinates, a semi-automated procedure has been developed using the package ALPACA (Porto et al. 2021) implemented in 3D Slicer version 4.11 (Fedorov et al. 2012). ALPACA superimposes a manually landmarked 3D surface to the target 3D surfaces and then automatically projects the template of landmarks and semi-landmarks on these surfaces. However, when the morphologies of the original and target surfaces differ too much, mislocations may occur. To limit this problem, the procedure was implemented separately for each stratigraphic level, or even several times in stratigraphic levels which displayed extensive morphological variation. In this case, the elements sharing similar shape features were empirically grouped for a dedicated ALPACA procedure. Each time, one randomly chosen specimen was manually landmarked using 3D Slicer, and the set of (semi-)landmarks was projected on all other specimens of the group. Residual mislocations may still occur, and the resulting landmarks were manually checked and corrected before subsequent analyses.
Morphometric analyses.—A Generalized Procrustes Analysis (GPA) was performed on the coordinates of the landmarks and semi-landmarks to standardize size, orientation, and position of the specimens (Rohlf and Slice 1990). The semi-landmarks were allowed to slide between the previous and next (semi-)landmark during the superimposition, while minimizing the bending energy criterion (Bookstein 1997). The aligned coordinates (a.k.a. Procrustes coordinates) constituted the shape variables for further analyses. The size of each conodont element was estimated by its centroid size (CSize), corresponding to the square root of the sum of squared distances from the landmarks and semi-landmarks to the centroid of the configuration. The proxy for element size was throughout the logarithm of the centroid size Log(CSize). In order to compare this size estimate to a linear measurement easily measured without 3D morphometrics, the length of the platform (P Length) was estimated as the inter-landmark distance between the dorsal tip of the platform and the mid-point between the insertion points of the margins and the free blade.
Polygnathus size differences between stratigraphic levels were tested using non-parametric Kruskal-Wallis tests complemented by post-hoc pairwise Wilcoxon tests. Relationships between two variables were investigated using Pearson correlations.
The morphometric analysis of shape variations relied on multivariate analyses. First, a Principal Component Analysis (PCA) was performed on the aligned coordinates in order to visualize the main pattern of morphological variation. Differences between stratigraphic levels, influence of bilateral asymmetry and relationship between size and shape (allometry) were investigated using non-parametric Procrustes analyses of variance (Procrustes ANOVA based on 9999 permutations, complemented by pairwise tests). Multivariate regression between size and aligned coordinates provided regression scores summarizing the shape variance along the regression model while including the residual variation in that direction of shape space (Drake and Klingenberg 2007).
Bilateral asymmetry was investigated using Canonical Variate Analysis (CVA). When the number of variables approaches or even exceeds the number of individuals, overfitting issues arise, leading to an unrealistic separation of the groups on the CVA axes and poor reclassification performance (Kovarovic et al. 2011; Mitteroecker and Bookstein 2011; Viscosi and Cardini 2011). A way to circumvent this issue is to perform a dimensionality reduction by computing the CVA on a reduced number of PCs instead of the whole set of aligned coordinates. In order to select the optimal number of PC axes to be retained, a series of CVAs were performed while adding an additional PC to the dataset at each iteration (Evin et al. 2013). For each iteration, the percentage of correct cross-validated reclassification between the groups was assessed. The optimal number of PCs is the smallest one that provides the highest percentage of correct cross-validated reclassification.
Differences in the amount of shape variance (disparity) have been tested among and within stratigraphic levels, by splitting the sample into two groups of conodonts, smaller or larger than the median size.
All the analyses were realised under R version 4.3.2 (R Core Team 2020). GPA, PCA, 3D reconstructions, Procrustes ANOVA and disparity analyses were performed using the R package geomorph (Adams and Otárola-Castillo 2013). Pairwise test have been realised using the RRPP package (Collyer and Adams 2018). CVA were performed using the Morpho package (Schlager 2017). Pearson correlations, Kruskal-Wallis and pairwise Wilcoxon tests are parts of the default statistics in R. Countings, centroid size platform length and aligned coordinates are provided as SOM (Supplementary Online Material available at http://app.pan.pl/SOM/app70-Nesme_etal_SOM.pdf).
Results
Unornamented Polygnathus size variation through the record.—The centroid size was highly correlated to the length of the platform (Pearson correlation R = 0.9926, P-value < 0.0001). Both size estimates were related by the equation P Length = 0.405 ± 0.006 * Log(CSize) + 0.452 ± 0.002 [mm].
Polygnathus elements size varies across stratigraphic levels (Kruskal Wallis test, P-value < 0.0001; Fig. 3). Specimens from the PS90 are the smallest, with no large-sized conodont elements. The size distribution is rather similar from PS11 to PS21. The last stratigraphic level, PS23, displays a very large size range, with the co-occurrence of very small and very large elements, and an overall domination of large-sized ones.
Pairwise differences in Log(CSize) between stratigraphic levels tested using Wilcoxon tests confirm this visual impression (Table 2). From PS11 to PS17, conodont elements share a similar size. Polygnathus elements from PS90 display a significantly smaller size (P-value < 0.01) compared to those of all other stratigraphic levels. Among the most recent levels, PS21 and PS22, and PS22 and PS23 do not differ in size.
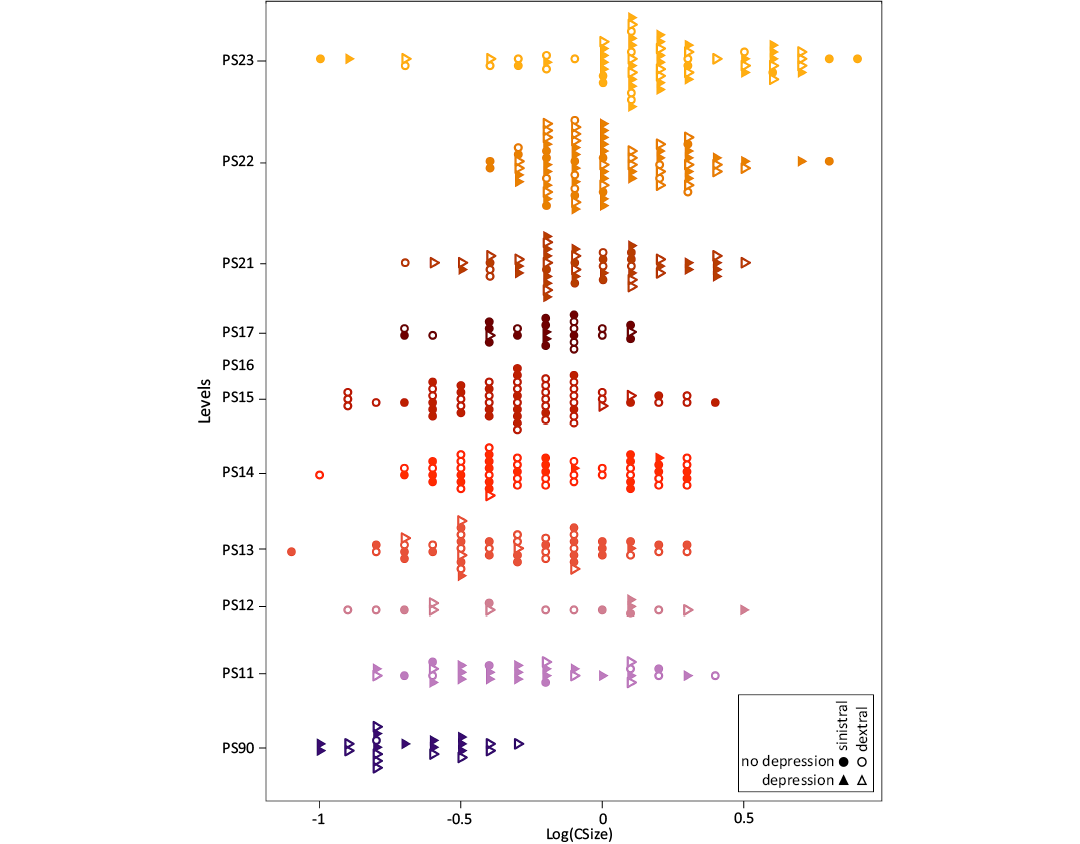
Fig. 3. Size distribution of the Famennian–Tournaisian Polygnathus in the successive levels of the Puech de la Suque section. The proxy for element size is the logarithm of the centroid size, Log(CSize). Each colour corresponds to a given level.
Table 2. Polygnathus size differences between levels along the Famennian–Tournaisian record at the Puech de la Suque section. The size proxy is the Log(CSize). P-values of pairwise Wilcoxon tests are provided. In bold: P-value < 0.0001, in italics: P-value < 0.01.
| |
PS90 |
PS11 |
PS12 |
PS13 |
PS14 |
PS15 |
PS17 |
PS21 |
PS22 |
|
PS11 |
0.0000 |
– |
– |
– |
– |
– |
– |
– |
– |
|
PS12 |
0.0069 |
1 |
– |
– |
– |
– |
– |
– |
– |
|
PS13 |
0.0001 |
1 |
1 |
– |
– |
– |
– |
– |
– |
|
PS14 |
0.0000 |
1 |
1 |
1 |
– |
– |
– |
– |
– |
|
PS15 |
0.0000 |
1 |
1 |
1 |
1 |
– |
– |
– |
– |
|
PS17 |
0.0000 |
1 |
1 |
1 |
1 |
1 |
– |
– |
– |
|
PS21 |
0.0000 |
0.3409 |
1 |
0.0092 |
0.6848 |
0.0042 |
0.6574 |
– |
– |
|
PS22 |
0.0000 |
0.0040 |
0.9617 |
0.0000 |
0.0026 |
0.0000 |
0.0042 |
1 |
– |
|
PS23 |
0.0000 |
0.0002 |
0.0440 |
0.0000 |
0.0000 |
0.0000 |
0.0000 |
0.0036 |
0.0317 |
Polygnathus shape variation between stratigraphic levels.—The first two axes of the PCA on the aligned coordinates explain 39.21% and 16.24% of the total variance (Fig. 4). Specimens are distributed in the morphospace as a triangular cloud of points, with an increase along PC1 being associated with a progressive decrease of the range covered on PC2. The different stratigraphic levels largely overlap in the morphospace, but some trends can be identified. Early levels (PS90, PS11) tend to plot along the lower side of the triangular cloud of points (low PC2 for low PC1), while more recent levels tend to plot along the upper side of the triangle (high PC2 for low PC1). Despite an overall significant difference (Procrustes ANOVA, aligned coordinates ~ side: P-value = 0.0001), dextral and sinistral elements are mixed all over the distribution in the PC1–PC2 morphospace. In contrast, elements with an aboral depression are on the lower side of the triangular cloud of points, along the trend of increasing PC2 with increasing PC1 (PC1+ and PC2+). Accordingly, elements with and without depression are overall differentiated (Procrustes ANOVA, aligned coordinates ~ depression: P-value = 0.0001).
Specimens corresponding to low PC1 and low PC2 scores have a broad subtriangular platform with a straight carina axis in oral view. In rostral view, margins are slightly raised, the carina is tall, the keel is aborally slightly curved, thus delineating a weak depression. The pit is located ventrally to the platform. Low PC1 and high PC2 scores correspond to specimens with a slender elongated platform in oral view. In rostral view, margins are flat, the carina is tall and the keel is flat leading to an absence of depression. The pit is located ventrally to the platform. Specimens with PC2 = 0 and high PC1 scores have an elongated subtriangular outline with a curved carina in oral view. In rostral view, margins are elevated, the carina is short, and the keel is aborally curved leading to a marked depression. The pit is situated on the aboral face of the platform.
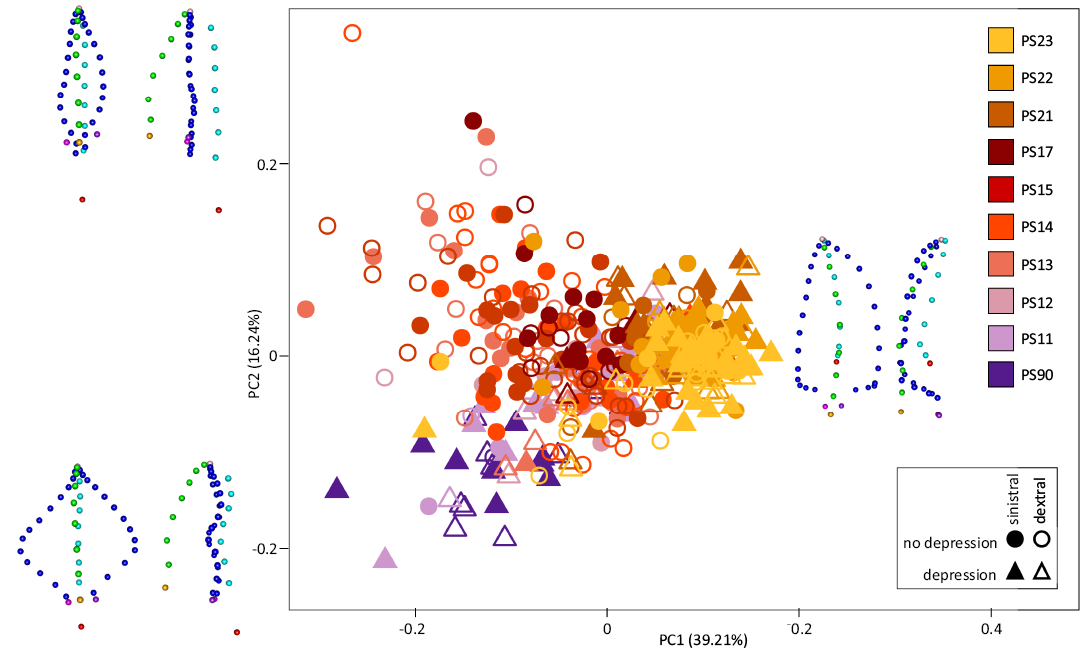
Fig. 4. Morphological variation of Polygnathus along the Famennian–Tournaisian record at the Puech de la Suque section. The morphospace corresponds to the first and second axes of the PCA on the aligned coordinates. The shapes predicted for the corners of the triangle (min PC1 and min PC2, min PC1 and max PC2, PC2 = 0 and max PC1) are represented in oral (left) and rostral (right) views.
To better investigate the differences along the section, the representation of the PC1–PC2 morphospace was split by stratigraphic levels (Fig. 5) and shape differences were assessed between levels (Table 3). The Famennian level (PS90) is different from all other levels, although it shares low PC2/low PC1 scores with the lowermost Tournaisian level (PS11), which in turn is similar to PS12. Levels from PS12 to PS17 share a similar range in the morphospace with no significant pairwise differences (Table 3). From PS21 onwards, a shift in the morphospace occurs, with an increase in frequency of elements with high PC1 scores.
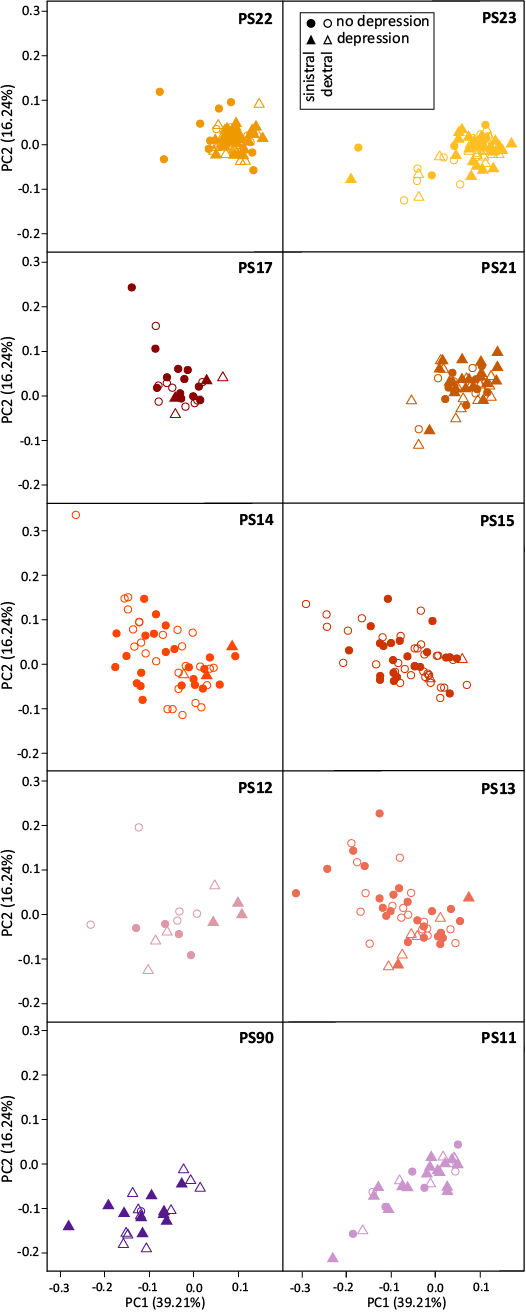
Fig. 5. Morphological variation of Polygnathus across levels at the Puech de la Suque section. The morphospace is the same as on Fig. 4 and corresponds to the first two axes of the PCA on the 3D aligned coordinates of all specimens. Each level is represented here on a separate panel.
Table 3. Shape differences of Polygnathus between levels at the Puech de la Suque section. Shape variables are the aligned coordinates, compared between levels using permutation-based pairwise tests. In bold: P-value < 0.0001, in italics: P-value < 0.01.
| |
PS90 |
PS11 |
PS12 |
PS13 |
PS14 |
PS15 |
PS17 |
PS21 |
PS22 |
|
PS11 |
0.0001 |
– |
– |
– |
– |
– |
– |
– |
– |
|
PS12 |
0.0001 |
0.2479 |
– |
– |
– |
– |
– |
– |
– |
|
PS13 |
0.0001 |
0.0020 |
0.1478 |
– |
– |
– |
– |
– |
– |
|
PS14 |
0.0001 |
0.0005 |
0.1436 |
0.3290 |
– |
– |
– |
– |
– |
|
PS15 |
0.0001 |
0.0014 |
0.0788 |
0.4859 |
0.4289 |
– |
– |
– |
– |
|
PS17 |
0.0001 |
0.0009 |
0.0843 |
0.0234 |
0.0689 |
0.0521 |
– |
– |
– |
|
PS21 |
0.0001 |
0.0001 |
0.0001 |
0.0001 |
0.0001 |
0.0001 |
0.0001 |
– |
– |
|
PS22 |
0.0001 |
0.0001 |
0.0001 |
0.0001 |
0.0001 |
0.0001 |
0.0001 |
0.0426 |
– |
|
PS23 |
0.0001 |
0.0001 |
0.0001 |
0.0001 |
0.0001 |
0.0001 |
0.0001 |
0.0001 |
0.0001 |
Different phases can be recognised not only based on the range of the morphospace occupancy, but also based on the pattern of covariation between PC1 and PC2, corresponding to the two trends of the triangular cloud of points. PS90 and PS11 clearly follow the trend of increasing PC1 and PC2 (PC1+ and PC2+) (Table 4). A pivot occurs thereafter, with PS13, PS14, PS15 and PS17 following the trend of decreasing PC2 with increasing PC1 (PC1+ and PC2-). The level PS12 once again appears as intermediate, mostly following the trend PC1+ and PC2+ but with one specimen plotting within the range of the trend PC1+ and PC2-. A second pivot occurs later on with PS21 and PS23 tending to follow again a PC1+ and PC2+ trend.
Table 4. Correlation between the first two axes of the PCA for the ten levels along the Puech de la Suque section. Pearson coefficient of correlation (R) of and corresponding P-values are provided. In bold: P-value < 0.0001, in italics: P-value < 0.01.
| |
PC1/PC2 |
Log(CSize)/PC1 |
Log(CSize)/PC2 |
|||
|
P-value |
R |
P-value |
R |
P-value |
R |
|
|
PS90 |
0.0047 |
0.5790 |
0.0000 |
0.9230 |
0.0146 |
0.5132 |
|
PS11 |
0.0000 |
0.8719 |
0.0000 |
0.9166 |
0.0000 |
0.7487 |
|
PS12 |
0.7742 |
0.0779 |
0.0000 |
0.8784 |
0.7684 |
-0.0800 |
|
PS13 |
0.0003 |
-0.5057 |
0.0000 |
0.8851 |
0.0020 |
-0.4392 |
|
PS14 |
0.0000 |
-0.5569 |
0.0000 |
0.8602 |
0.0002 |
-0.4850 |
|
PS15 |
0.0000 |
-0.5245 |
0.0000 |
0.8782 |
0.0001 |
-0.4903 |
|
PS17 |
0.0068 |
-0.5267 |
0.0000 |
0.7177 |
0.0593 |
-0.3824 |
|
PS21 |
0.0035 |
0.4098 |
0.0000 |
0.9034 |
0.0025 |
0.4227 |
|
PS22 |
0.2425 |
-0.1357 |
0.0000 |
0.7776 |
0.0382 |
-0.2382 |
|
PS23 |
0.0000 |
0.5164 |
0.0000 |
0.8747 |
0.0001 |
0.4670 |
Defining Operational Taxonomic Units (OTUs).—The occurrence of an aboral depression has been proposed as a diagnostic character to split Polygnathus sensu lato into Polygnahtus sensu stricto and Neopolygnathus. The morphometric descriptors were able to characterize the aboral morphology of the elements, but the resulting morphospace did not segregate contemporary specimens with and without depression. Specimens with depression occurred mostly along the lower side of the triangular cloud of points (PC1+ and PC2+), and are more frequent in stratigraphic levels characterized by this trend, but specimens of the same levels but without depression tend to plot in the same range of the morphospace. This undermines the relevance of splitting Polygnathus sensu lato into Polygnathus sensu stricto and Neopolygnathus, and thereafter, all specimens are tentatively considered as belonging to the same genus (Polygnathus sensu lato). This also undermines the definition of Po. communis and Po. purus and it suggests that patterns of shape variation changed through time. In order to better investigate this issue, consecutive stratigraphic levels sharing similar size range, morphospace occupancy, and patterns of PC1¬PC2 covariation were pooled into “Operational Taxonomic Units” (OTUs). There are defined as follows (see illustrations on Fig. 6):
(i) OTU1 (PC1+ and PC2+): PS90, kept alone because being the only Devonian level,
(ii) OTU2 (PC1+ and PC2+): PS11 and PS12.
These levels occupy a common morphospace despite the fact that the PC1–PC2 correlation is not significant within PS12. In PS12, the outlying specimen in the PC1–PC2 morphospace was discarded, as it clearly does not belong to the same OTU as the rest of the individuals, plotting along the PC1+PC2+ trend.
(iii) OTU3 (PC1+ and PC2-): PS13-14-15-17,
(iv) OTU4 (PC1+ and PC2+): PS21-22-23.
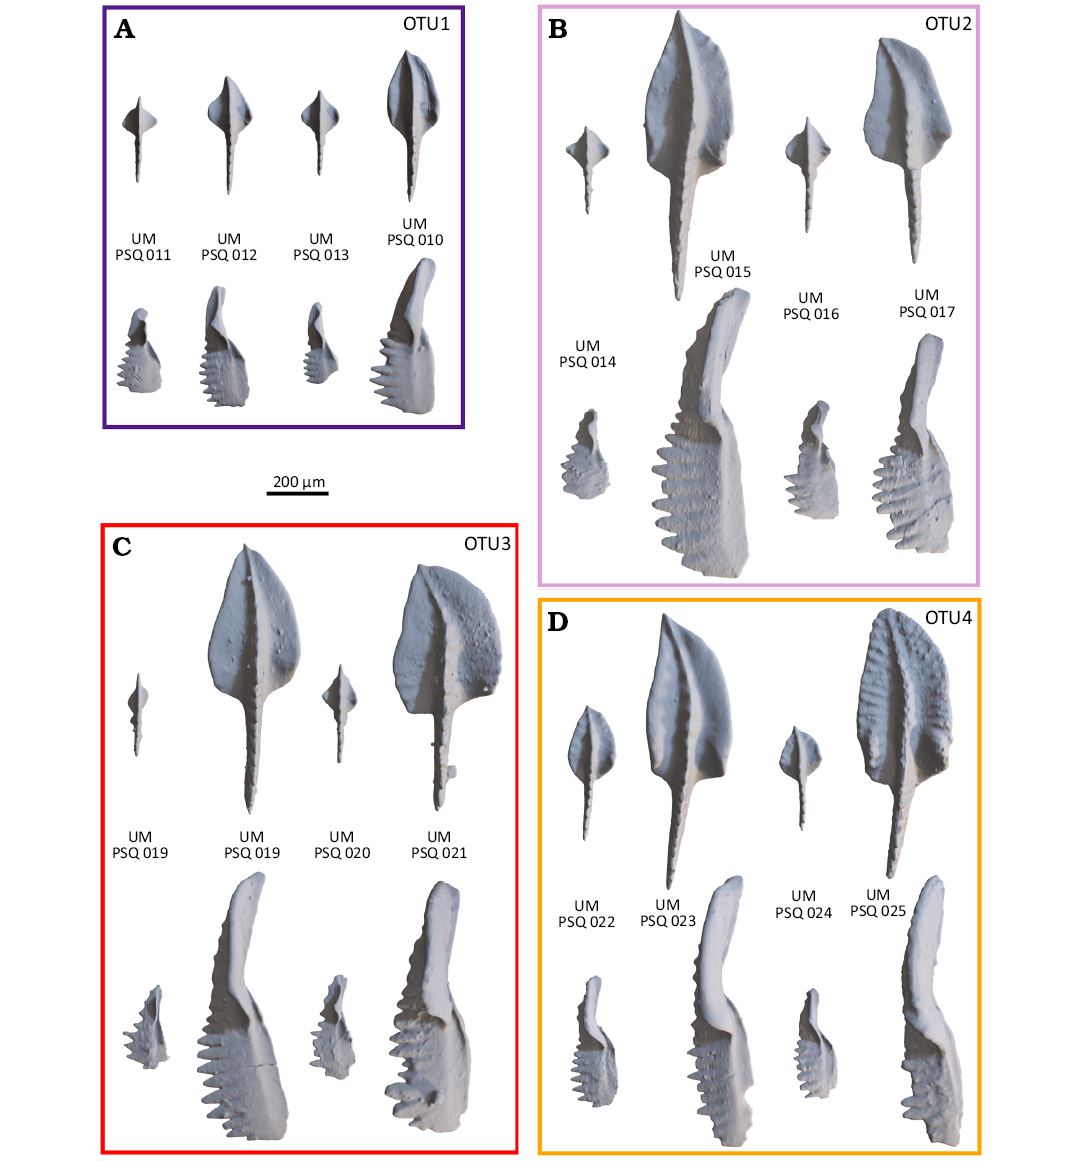
Fig. 6. Morphological variation within each OTU, illustrated by small and large, dextral and sinistral specimens (with repository numbers). For each OTU, the specimens are organized as follow: small sinistral, large sinistral, small mirrored dextral, large mirrored dextral. For each OTU, oral (above) and rostral (below) views of selected specimens are provided. A. OTU1, all specimens are from the Puech de la Suque (PS90), Bispathodus ultimus Zone. B. OTU2, all specimens are from the Puech de la Suque (PS11), Siphonodella sulcata Zone. C. OTU3, all specimens are from the Puech de la Suque (PS13), Siphonodella bransoni Zone. D. OTU4, specimens are from the Puech de la Suque (PS21), Siphonodella jii Zone.
Allometric shape variation across OTUs.—In all stratigraphic levels, the first PC axis is strongly and positively correlated to size, whereas PC2 can be positively or negatively related to size (Tables 4, 5). This suggests that the two major trends PC1+ and PC2+ and PC1+ and PC2- correspond to two allometric trajectories converging towards a typical adult Polygnathus shape.
Allometric trajectories were therefore investigated within each OTU (Fig. 7). Polygnathus shape was strongly related to size (Procrustes ANOVA in each OTU, P-value = 0.0001), underlying the importance of allometric variation. Allometric trajectories differed between OTUs, however, as shown by the significant interaction term in a model including size and OTU as explanatory factors of shape (Procrustes ANOVA, shape ~ Log(CSsize) * OTU: P-valuesize = 0.0001, P-valueOTU = 0.0001, P-valuesize:OTU = 0.0001).
OTUs 1 and 2 (Fig. 7A, B) share a similar allometric pattern. Small specimens have a wide oval outline with a sharply pointed dorsal tip and an almost straight carina axis in oral view. In rostral view, margins are elevated in a point near the middle of the margin forming geniculation point, the carina is tall and the pit is situated aborally to the free blade. A marked depression is present on the aboral side of the element. Large specimens have a leaf-shaped outline and a carina axis strongly curved in oral view. In rostral view, the carina is short and the pit is on the aboral face of the platform. However, the margins of the large specimens of the OTU2 are elevated all along the margin, while for the OTU1 they are elevated only in the most ventral part. A marked depression is present on the aboral side of the element.
The OTU3 (Fig. 7C) is characterized by small specimens with a slender lanceolate outline sharply pointed in the dorsal part and an almost straight carina axis in oral view. In rostral view, margins are flat, the carina is tall and the pit is located aborally to the free blade. Larger specimens have an elongated leaf-shaped platform and a carina axis strongly curved caudally in oral view. In rostral view, margins are elevated, the carina is short and the pit is located on the aboral face of the platform. A very lightly marked depression is present on the aboral side of the element.
In OTU4 (Fig. 7D), small specimens display a subtriangular outline and an almost straight carina axis in oral view. In rostral view, margins are elevated in the dorsal two-thirds of the platform, the carina is tall and the basal cavity is located in the ventral-most part of the platform, next to the insertion points. A marked depression is present in the ventral part of the keel. Larger specimens have an elongated subtriangular-leaf-shaped outline and a carina axis strongly curved caudally in oral view. In rostral view, margins are elevated, the carina is short, and the pit is located on the aboral face of the platform. A marked depression is present in the aboral side of the element.
To summarize the results, small specimens are very different in shape between the OTUs, being either very wide and oval in oral view as in OTU1, or thin and lanceolate as in OTU3. In contrast, large specimens share similar characteristics whatever the OTUs, being lanceolate with elevated margins. Except for OTU1 in which the largest size observed is relatively small (Log(CSize) < 0), the allometric trajectories appear as non-linear in the three other OTUs, with less shape changes occurring towards very large size (Log(CSize) > 0, approximately corresponding to a platform length of 0.45 mm).
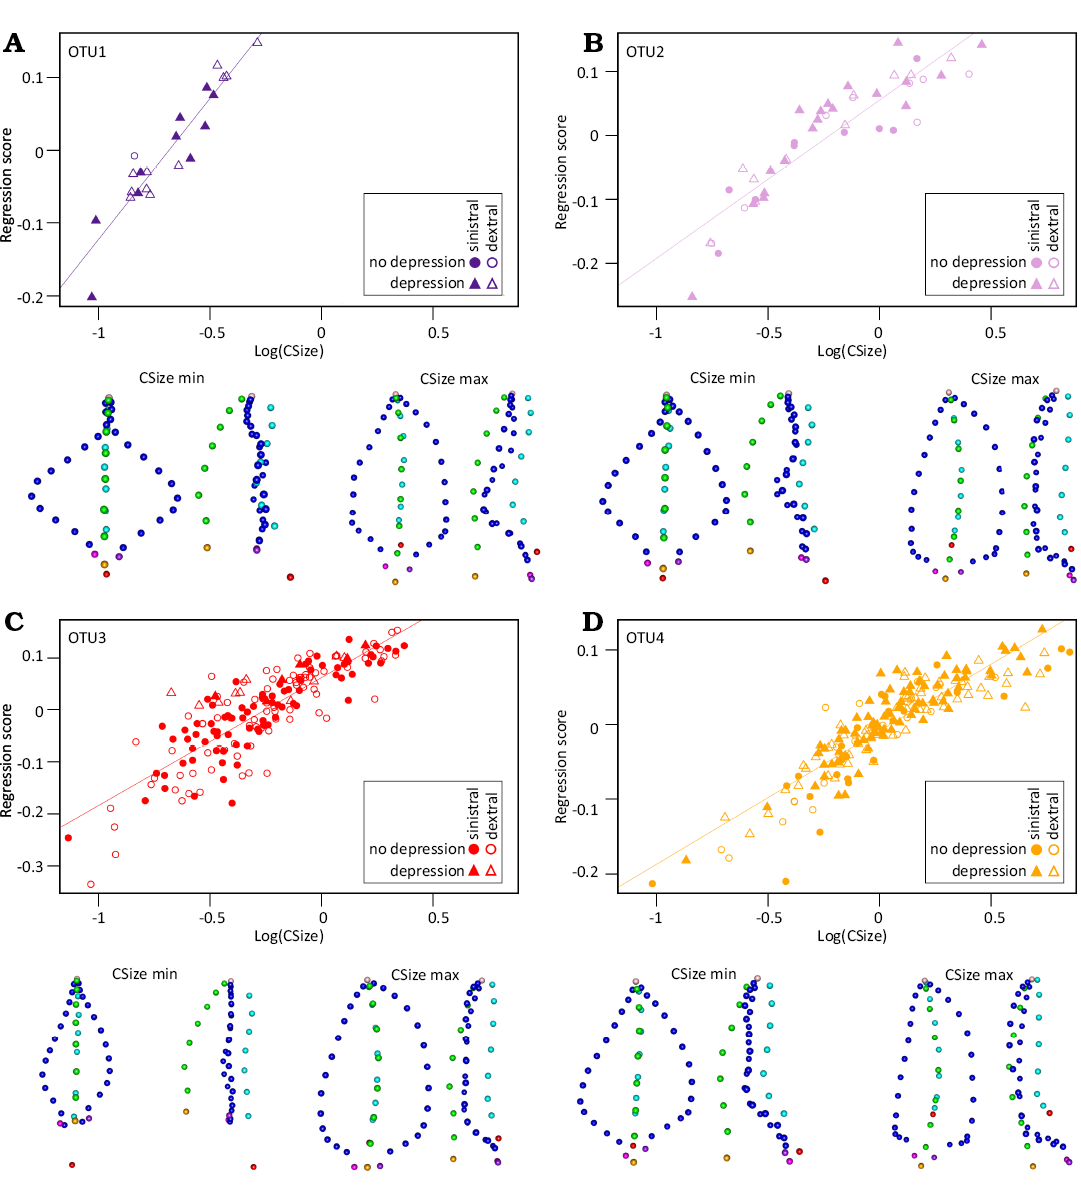
Fig. 7. Allometric relationship between Polygnathus size and shape within the OTUs (A, OTU1; B, OTU2; C, OTU3; D, OTU4). The size proxy Log(CSize) is plotted against the regression score, expressing the covariation between size and shape. Coloured lines represent the linear regression between the two size and regression score within each OTU (all P-values < 0.0001). Shapes predicted for the minimum (Log(CSize) min) and maximum size (Log(CSize) max) of their respective OTU are represented in oral (left) and rostral (right) views under each panel.
Bilateral asymmetry in the different OTUs.—Bilateral asymmetry was only significant in OTUs 3 and 4 (Table 5). When performing a CVA with a dimensionality reduction in each OTU, however, the percentage of correct reclassification between dextral and sinistral sides were well above 90% in all OTUs, indicating the consistent occurrence of bilateral asymmetry. The percentage of correct reclassification tended to increase from the earliest to the latest OTU, together with the number of PCs required to adequately describe the signal, suggesting that bilateral asymmetry increased in consistency and complexity of the morphological signal involved. When considering reconstructed shapes corresponding to dextral and sinistral elements in each OTU (Fig. 8), differences were tenuous but sinistral elements shared a rostral insertion point positioned slightly more dorsally and really more aborally than dextral elements.
Table 5. Bilateral asymmetry in the different OTUs. Differences between dextral and sinistral sides were tested using Procrustes ANOVA on the aligned coordinates (P-values provided). Number of PC axes retained in the procedure of dimensionality reduction is further provided (Nb opti PCs) as well as the percentage of correct cross-validated reclassification (CVP). In bold: P-value < 0.0001, in italics: P-value < 0.01.
| |
Shape ~ side |
Dimensionality reduction |
Dextral/sinistral reclassification |
| |
P-value |
Nb opti PCs |
CVP (%) |
|
OTU1 |
0.2493 |
9 |
91.9 |
|
OTU2 |
0.0843 |
11 |
95.6 |
|
OTU3 |
0.0013 |
18 |
97.3 |
|
OTU4 |
0.0001 |
39 |
98.4 |
To compare the pattern of bilateral asymmetry across OTUs, a CVA including sinistral and dextral groups for all OTUs was performed, based on an optimized number of variables (49 PCs) (Fig. 9). The first axis of the CVA (40.7% of between-group variance) displays a shared signal of bilateral asymmetry. Dextral elements have high CV1 scores while sinistral specimens have low CV1 scores whatever the OTU. The second axis (30.5%) separates OTU4 from the three other OTUs. This suggests that whatever the OTU, the signal related to bilateral asymmetry was comparable. This was confirmed by a test showing significant differences between sides and OTUs, but no interaction between both factors (procD.lm(shape ~ side * OTU): P-valueside = 0.0001, P-valueOTU = 0.0001, P-valueside:OTU = 0.2077).
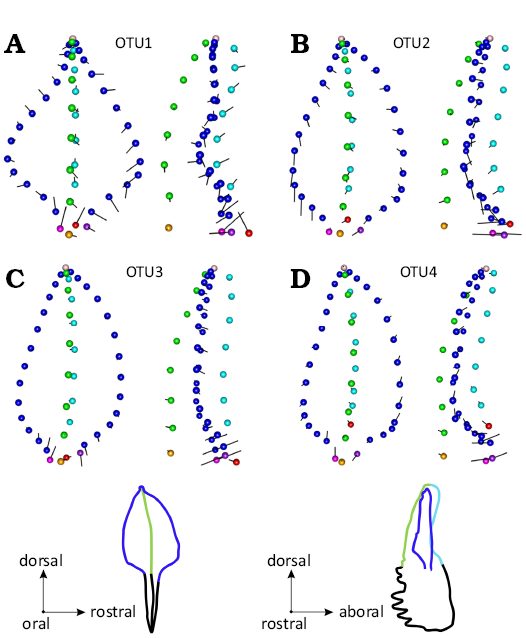
Fig. 8. Shape signal associated with bilateral asymmetry (A, OTU1; B, OTU2; C, OTU3; D, OTU4). For each OTU, the mean shape of sinistral elements is represented in oral (left) and rostral (right) views; black vectors show the deformation towards the dextral mean shape. The size of the vector has been magnified (×2) in order to highlight the differences.
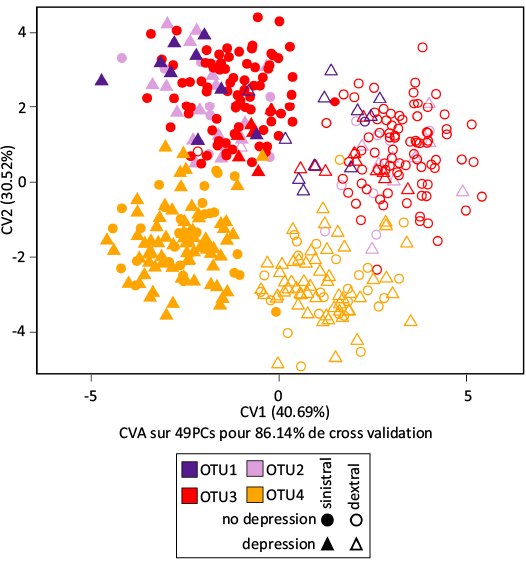
Fig. 9. Bilateral asymmetry across the OTUs. The morphospace corresponds to the two first axes of the CVA separating sinistral and dextral specimens within each OTU, based on the optimized number of PC axes (49 PCs, CVP = 86.1%).
Morphological disparity and the different sources of variance.—In order to summarize the effects of size changes across OTUs on allometric trajectories and bilateral asymmetry, each OTU was split into its smallest (Log(CSize) < median) and its largest (Log(CSize) > median) components. Morphological disparity (i.e., the amount of morphological variance) was higher in the small-sized compared to the large-sized fraction in all OTUs except the first one (Fig. 10), echoing the fact that Polygnathus elements did not reach large sizes in OTU1 and thus did not reach the plateau observed in the allometric trajectories of the other OTUs (see Fig. 7). A similar trend was observed not only within OTU but on the total assemblage.
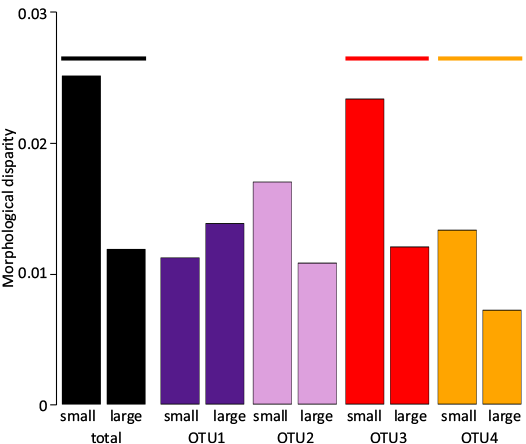
Fig. 10. Morphological disparity in small- vs large-sized elements within and among OTUs. The bars are coloured according to their OTU. A coloured line signals significant difference of morphological disparity between the small and large class within each OTU (permutation-based P-value < 0.01).
Discussion
Relationships between taxonomic units and morphometric variation in unornamented Devonian–Carboniferous Polygnathus.—A first issue to address was the definition to be retained for the terminology “Polygnathus”. A split of the genus has been proposed, with the definition of Neopolygnathus based on the presence of an aboral depression (Barskov et al. 1991; Vorontsova 1996). Although the morphometric descriptors were able to capture this morphological trait, the presence or absence of a depression did not lead to the occupancy of distinct zones in the morphospace. Rather, conodonts with and without aboral depression co-occurring in a given stratigraphic level shared similar zones in the morphospace and similar allometric trajectories; temporal changes in size and allometric trajectories occurred similarly for both morphotypes. This congruence in the patterns of intra-population variance, including allometry, for P1 elements with and without aboral depression undermines the relevance of this trait as diagnostic character and therefore of Neopolygnathus as an independent genus. It rather argues for retaining the definition of Polygnathus sensu lato, including elements with and without an aboral depression. Using quantitative morphometrics as in the present study, this binary definition rather emerges as a continuous variation from a “marked” to an “absent” depression. The discrepancy may be partly due to a difference of appreciation between a visual inspection under the binocular, and measurements performed on 3D surfaces. It also probably echoes what has been repeatedly observed in Polygnathus (Klapper and Vodrážková 2013) and other conodont genera such as Palmatolepis, where characteristics taxonomic species correspond to end-members of a continuous morphological variation (Girard et al. 2004). In that respect, the taxonomic species Po. communis (with depression) and Po. purus (without depression) are a way to describe an extensive morphological variation.
The occupancy of the morphospace however, changed through time, suggesting a turnover of “units” termed here OTU, and reflected by a relay between the taxonomic species Po. communis and Po. purus and their subspecies (Feist et al. 2020). The OTUs were tentatively defined here by shared size range, overall shape, and patterns of morphological covariation, but the occurrence of a specimen in PS12 outside of the range of the dominant OTU shows that some OTUs probably co-occurred, and that this level constitutes a pivotal point in their temporal relay.
Evolution of Polygnathus size during the early Carboniferous.—Assessing size trends through time is all the more important when considering Polygnathus evolution as the importance of allometric variation may largely condition shape changes. Given the continuous growth of conodont elements, their size probably reflects body size and therefore the growth stage of the former animal (Purnell 1994; Donoghue and Purnell 1999). Size distribution in a conodont assemblage therefore records, among other things, reproductive strategy and mortality patterns (Girard and Renaud 2008; Girard et al. 2023). Possible taphonomic biases should be limited at the Puech de la Suque section due to calm offshore depositional context (Feist et al. 2020). Some genera like Palmatolepis display size distributions that are massively dominated by small-sized elements, suggesting an important investment in reproduction coupled to frequent juvenile mortality according to a r-selected demographic strategy (Girard and Renaud 2008). In contrast, the unornamented Polygnathus appears to display balanced size distributions throughout the record of the Puech de la Suque, suggesting life-history traits rather associated with a K-selected demographic strategy. However, shifts in size are observed, the most important of which being a size increase occurring between the Upper Devonian and the first Carboniferous stratigraphic level.
This pattern may appear surprising at first glance since the Late Devonian was punctuated by an important mass extinction associated with the Hangenberg event (Walliser 1996; Kaiser et al. 2016). Size-reduction has been frequently suggested to be a response to stressful periods, notably due to a collapse of the food chains favouring small organisms (Urbanek 1993; Twitchett 2007; Song et al. 2011; Wiest et al. 2015). Such response may not be characteristic for Polygnathus, however, since through the Frasnian/Famennian boundary, marked by another important mass extinction, Polygnathus rather displayed a momentary size increase during the perturbed period rather than a clear size decrease after the crisis (Girard and Renaud 1996).
Such size increase in the aftermath of a biotic crisis has been reported in various marine organisms such as molluscs, brachiopods, or foraminifers (Atkinson et al. 2019; Feng et al. 2020; Zhuravlev and Wood 2020). The underlying causes of such increase in body size are debated, and proposed hypotheses involved a drop in temperature (Atkinson 1994), an increase in the quantity or quality of food resources (Atkinson and Wignall 2020), or the re-diversification from small-bodied species, with rapid reproductive rates, prone to dominate the communities during the periods of crisis (Sallan and Galimberti 2015).
Polygnathus was abundant during and after the two successive mass extinctions of the Late Devonian (Frasnian/Famennian and Famennian/Carboniferous), suggesting that it might have prospered in depauperate ecosystems momentarily devoid of competitors, allowing an improved access to food resources. After a relative stability in the early Carboniferous, the size of the unornamented Polygnathus increased progressively during the Siphonodella jii and Siphonodella sandbergi zones. Such long-term size increase is frequent in the fossil record, corresponding to the so-called “Cope’s rule”, stating that size tends to increase over time within given clades (Brown and Maurer 1986; Alroy 1998; Hunt and Roy 2006). The causes underlying this trend are still debated, from response to climate changes (Hunt and Roy 2006) to selection for increased survival and/or reproductive success (Kingsolver and Pfennig 2004). Whatever the cause, Cope’s rule seems to be frequent in conodonts (Ginot and Goudemand 2019) and the trend observed in Carboniferous Polygnathus may corroborate this observation.
Allometric trajectory and the ontogenetic dynamics of functional constraints.—Common features were shared by the allometric trajectories of all Polygnathus OTUs considered here. Small-sized elements were variable in shape, but shared an aboral basal cavity located more ventrally than what is observed in large-sized elements. This indicates a ventral expansion of the platform along ontogeny, in agreement with previous observations (Gedik 1968; Dzik 2008). From different small-sized elements, allometric trajectories of the different OTUs converged towards large-sized phenotypes sharing an extension of the platform and an elevation of the margins. Such traits have been shown to be under functional constraints during occlusion, by conditioning occlusal motion and dissipating stress (Martinez-Perez et al. 2016).
The shape of feeding structures is usually under strong functional constraints related to occlusal motion and diet (Davis 2011; Frédérich and Vandewalle 2011; Smits and Evans 2012; D’Amore 2015; Polly 2015). The allometric trajectories observed in Polygnathus therefore suggest ontogenetic variation in the dynamics of occlusion, possibly related to changes in diet.
The lack of wear on early growth stages of the elements suggested that conodonts may have acquired their mature feeding only after an initial stage characterized by a different feeding ecology (Shirley et al. 2018). The size of the feeding apparatus largely conditions the size of the food items that can be processed (e.g., Luczkovich et al. 1995; Dayan and Simberloff 1998; Ward-Campbell et al. 2005). The mean size of the large-sized fraction is 1.5 times larger than the small-sized fraction in OTU1 and more than three times larger in OTU2 and OTU4. Even without direct evidence on their respective feeding habits, it is likely that such a size increase was associated with a change in food items. Altogether, this suggests higher functional constraints on large than on small-sized Polygnathus elements (Renaud et al. 2021b), in association with the development of large platform with elevated margins favouring tight and efficient occlusion. In small elements, most of the occlusal motion was probably guided by the expanded free blade (Martinez-Perez et al. 2016) that relatively decreases in importance along ontogeny, compared to the extension and elevation of the margins.
Supporting an increase in functional constraints in large-sized elements, they were found to be morphologically less diverse than small-sized ones, both within and among OTUs. Whatever the OTU, large-sized Polygnathus elements seem thus to achieve a morphology favouring the accommodation and dissipation of the stress related to a tooth-like occlusion (Martinez-Perez et al. 2016), while small-sized morphologies, being under less important functional constraints, appear more free to vary.
What seems to be true within OTU could be true between OTUs as well. Mean size increased by almost four times between OTU1 and OTU4. Even along a conserved allometric trajectory, such a size increase would drive shape changes, especially for small and intermediate sizes due to the non-linear allometric pattern. A phyletic size increase congruent with Cope’s rule would thus drive an evolution of more extreme shapes with developed platform, due to a peramorphic process (prolongation and/or acceleration of the development), a response even more pronounced that the starting morphology was small-sized.
Such heterochronic processes might be frequent in conodonts since they have been recently proposed to explain the evolution of different genera such as Siphonodella (Plotitsyn and Zhuravlev 2023) and Dasbergina (Świś 2023) as well as response to temperature variation in different groups of conodonts (Souquet et al. 2022).
Conserved patterns of bilateral asymmetry.—The differences between dextral and sinistral elements of a given OTU observed here (dextral elements with a caudal platform slightly more expanded, and a more elevated rostral margin compared to sinistral elements) overall match the observations done on Famennian Polygnathus (Renaud et al. 2021b) and the lower Frasnian cluster described in Martinez-Perez et al. (2016). Regarding classification rates, dextral and sinistral elements were correctly classified with a rate above 90%, suggesting an almost fixed directional asymmetry, defined as consistent differences between dextral and sinistral forms (Palmer 2004), in agreement with observation on the Famennian species Po. glaber and Po. communis (Renaud et al. 2021b).
Convergent evolution of Polygnathus in an eco-evo-devo perspective.—Functional and developmental constraints are known to vary along ontogeny, leading to variations in disparity levels. In icriodontan conodonts, initial stages of development seem to be relatively poorly constrained, followed by intermediate stages sharing the typical phenotype of the species, before the continuous growth generates extensive morphological variation (Girard et al. 2022). This results in a “hourglass-like” model of disparity along ontogeny. In Palmatolepis, an extensive disparity of large-sized elements develops from rather homogeneous small-sized morphologies (Girard et al. 2004). In Polygnathus, functional constraints seem to increase along ontogeny, leading to a decrease of morphological variation in large-sized elements. These discrepancies in the ontogenetic pattern of disparity most probably relate to differences in the kind of diet shift along ontogeny, processes of element growth, and functional constraints occurring in these very different genera. In Polygnathus, ecological and environmental factors, by driving recurrent phylogenetic size increase from small-sized ancestor, may drive convergent evolution of Polygnathus shape through peramorphosis along convergent allometric trajectories. This also means that depending on the pattern of disparity change along ontogeny, relevant stages to identify diagnostic characters may vary. In the case of Polygnathus, convergent allometric trajectories may blur phylogenetic signals in large-sized elements.
Conclusions
The present study used 3D geometric morphometric methods to explore the sources of morphological variation, including allometric trends and bilateral asymmetry, in order to better understand the constraints acting on the evolution and diversification of unornamented Polygnathus conodonts across the Devonian/Carboniferous boundary. Most expectations were validated: (i) allometric trajectories varied along time but converged towards similar adult shapes, leading to a decreased morphological disparity in large-sized classes; (ii) General patterns of bilateral asymmetry were conserved across populations over time, supporting their role in stabilizing occlusion; (iii) patterns of size evolution can indeed influence shape evolution by modulating the largest sizes reached along allometric trajectories. Such convergent allometric trajectories are candidates to generate convergent evolution through peramorphosis in periods of Polygnathus size increase, but further studies in other time periods would be required to validate this scenario.
Such 3D methods are becoming more and more frequent for studies of conodont morphological evolution (e.g., Renaud et al. 2021b; Assemat et al. 2023; Kelz et al. 2023). However, 2D studies still allow more extensive sampling due to easiness and low costs. 3D approaches are definitely required to address the complexity of the constraints related to occlusion. They also raise questions regarding differing perception between direct observations and measures derived from 3D surfaces. However, most of the important traits, especially the overall shape of the platform varying along ontogenetic trajectories, should be captured using 2D projections (Renaud et al. 2021b), opening the way to more extensive studies to assess long-term phyletic evolution and coupling with environmental variations.
A challenge remains to assess evolutionary units within a conodont genus. A recent study on Late Devonian conodont genus Palmatolepis suggested that evolutionary units share similar patterns of morphological variation, including allometry (Renaud et al. 2021a). The present study agrees with these conclusions, suggesting that shared allometric trends could points to evolutionary units. A challenge remains, however, for successfully delineating such units, especially when they co-occur in the same stratigraphic levels, since clustering methods aim at grouping close specimens, and not those sharing common trends of variation.
Acknowledgements
We thank Anne-Lise Charruault (ISEM) and Louise Souquet (Department of Mechanical Engineering, University College London, UK) for their precious contribution to the acquisition of the material studied here, as well as Mathilde Bouchet (Institut de Génomique Fonctionelle de Lyon, France) for her kind assistance during the scanning sessions, and Renaud Lebrun (ISEM) for the treatment of 3D data. We further deeply thank the two reviewers, Nicholas Hogancamp (The Bedrock & Earth History Research Organization, Pennsylvania, USA) and Przemysław Świś (Department of Chemical and Geological Sciences, Modena, Italy), for their highly constructive remarks. This work was founded by the program Tellus-Interrvie grant DECA (CNRS-Institut National des Sciences de l’Univers), by the LabEx CeMEB and publicly funded through the I-SITE Excellence Program of the University of Montpellier, under the Investissements France 2030. This is publication ISEM 2025-017.
Editor: Andrzej Kaim.
References
Adams, D.C. and Otárola-Castillo, E. 2013. Geomorph: an R package for the collection and analysis of geometric morphometric shape data. Methods in Ecology and Evolution 4: 393–399. Crossref
Aldridge, R.J., Briggs, D.E.G., Smith, M.P., Clarkson, E.N.K., and Clark, N.D.L. 1993. The anatomy of conodonts. Philosophical Transactions of The Royal Society B Biological Sciences 340: 405–421. Crossref
Aldridge, R.J., Purnell, R.J., Gabbott, S.E., and Theron, J.N. 1995. The apparatus architecture and function of Promissum pulchrum Kovács-Endrödy (Conodonta, Upper Ordovician) and the prioniodontid plan. Philosophical Transactions of the Royal Society of London. Series B: Biological Sciences 347: 275–291. Crossref
Aldridge, R.J., Smith, M.P., Norby, R.D., and Briggs, D.E.G. 1987. The architecture and function of Carboniferous polygnathacean conodont apparatuses. In: R.J. Aldridge (ed.), Palaeobiology of Conodonts, 63–76. Ellis Horwood, Chichester.
Alroy, J. 1998. Cope’s Rule and the dynamics of body mass evolution in North American fossil mammals. Science 280: 731–734. Crossref
Aretz, M., Herbig, H.G., Wang, X.D., Gradstein, F.M., Agterberg, F.P., and Ogg, J.G. 2020. Chapter 23—The Carboniferous period. In: F.M. Gradstein, J.G. Ogg, M.D. Schmitz, and G.M. Ogg (eds.), Geologic Time Scale 2020, 811–874. Elsevier, Amsterdam. Crossref
Assemat, A., Thiery, G., Lieffroy, T., and Girard, C. 2023. Shape diversity in conodont elements, a quantitative study using 3D topography. Marine Micropaleontology 184: 102292. Crossref
Atkinson, D. 1994. Temperature and organism size—A biological law for ectotherms? Advances in Ecological Research 25: 1. Crossref
Atkinson, J.W. and Wignall, P.B. 2020. Body size trends and recovery amongst bivalves following the end-Triassic mass extinction. Palaeogeography, Palaeoclimatology, Palaeoecology 538: 109453. Crossref
Atkinson, J.W., Wignall, P.B., Morton, J.D., and Aze, T. 2019. Body size changes in bivalves of the family Limidae in the aftermath of the end-Triassic mass extinction: the Brobdingnag effect. Palaeontology 62: 561–582.
Balter, V., Martin, J.E., Tacail, T., Suan, G., Renaud, S., and Girard, C. 2019. Calcium stable isotopes place Devonian conodonts as first level consumers. Geochemical Perspectives Letters: 36–39. Crossref
Barskov, I.S., Vorontsova, T.N., Kononova, L.I., and Kuz’min, A.V. 1991. Reference Book on the Devonian and Lower Carboniferous Conodonts. 182 pp. [in Russian]. Moskovskij gosudarstvennyj Universitet, Moskva.
Bookstein, F.L. 1997. Procrustes distance, bending energy, and the biometrical modeling of shape phenomena. International Journal of Shape Modeling 03: 17–38. Crossref
Briggs, D.E.G., Clarkson, E.N.K., and Aldridge, R.J. 1983. The conodont animal. Lethaia 16: 1–14. Crossref
Brown, J.H. and Maurer, B.A. 1986. Body size, ecological dominance and Cope’s rule. Nature 324: 248–250. Crossref
Chen, Y., Neubauer, T.A., Krystyn, L., and Richoz, S. 2016. Allometry in Anisian (Middle Triassic) segminiplanate conodonts and its implications for conodont taxonomy. Palaeontology 59: 725–741. Crossref
Collyer, M.L. and Adams, D.C. 2018. RRPP: An R package for fitting linear models to high-dimensional data using residual randomization. Methods in Ecology and Evolution 9: 1772–1779. Crossref
Corradini, C., Henderson, C., Barrick, J., and Ferretti, A. 2024. Conodonts in biostratigraphy. A 300-million-years long journey through geologic time. Newsletters on Stratigraphy [available online, https://dx.doi.org/10.1127/nos/2024/0822]. Crossref
D’Amore, D.C. 2015. Illustrating ontogenetic change in the dentition of the Nile monitor lizard, Varanus niloticus: a case study in the application of geometric morphometric methods for the quantification of shape-size heterodonty. Journal of Anatomy 226: 403–419. Crossref
Davis, B.M. 2011. Evolution of the tribosphenic molar pattern in early mammals, with comments on the “Dual-Origin” hypothesis. Journal of Mammalian Evolution 18: 227–244. Crossref
Dayan, T. and Simberloff, D. 1998. Size patterns among competitors: ecological character displacement and character release in mammals, with special reference to island populations. Mammal Review 28: 99–124. Crossref
Donoghue, P.C.J., Purnell, M.A., Aldridge, R.J., and Zhang, S. 2008. The interrelationships of ‘complex’ conodonts (Vertebrata). Journal of Systematic Palaeontology 6: 119–153. Crossref
Donoghue, P.C.J., Forey, P.L., and Aldridge, R.J. 2000. Conodont affinity and chordate phylogeny. Biological Reviews of the Cambridge Philosophical Society 75: 191–251. Crossref
Donoghue, P.C.J. and Purnell, M.A. 1999. Growth, function, and the conodont fossil record. Geology 27: 251–254. Crossref
Drake, A.G. and Klingenberg, C.P. 2007. The pace of morphological change: historical transformation of skull shape in St Bernard dogs. Proceedings of the Royal Society B: Biological Sciences 275: 71–76. Crossref
Du, Y., Onoue, T., Tomimatsu, Y., Wu, Q., and Rigo, M. 2023. Lower Jurassic conodonts from the Inuyama area of Japan: implications for conodont extinction. Frontiers in Ecology and Evolution 11: 1135789. Crossref
Dzik, J. 1997. Emergence and succession of Carboniferous conodont and ammonoid communities in the Polish part of the Variscan sea. Acta Palaeontologica Polonica 42: 57–170.
Dzik, J. 2008. Evolution of morphogenesis in 360-million-year-old conodont chordates calibrated in days. Evolution & Development 10: 769–777. Crossref
Evin, A., Cucchi, T., Cardini, A., Strand Vidarsdottir, U., Larson, G., and Dobney, K. 2013. The long and winding road: identifying pig domestication through molar size and shape. Journal of Archaeological Science 40: 735–743. Crossref
Fedorov, A., Beichel, R., Kalpathy-Cramer, J., Finet, J., Fillion-Robin, J.-C., Pujol, S., Bauer, C., Jennings, D., Fennessy, F., Sonka, M., Buatti, J., Aylward, S., Miller, J.V., Pieper, S., and Kikinis, R. 2012. 3D Slicer as an image computing platform for the Quantitative Imaging Network. Magnetic Resonance Imaging 30: 1323–1341. Crossref
Feist, R., Cornée, J.-J., Corradini, C., Hartenfels, S., Aretz, M., and Girard, C. 2020. The Devonian–Carboniferous boundary in the stratotype area (SE Montagne Noire, France). Palaeobiodiversity and Palaeoenvironments 101: 295–311. Crossref
Feng, Y., Song, H., and Bond, D.P.G. 2020. Size variations in foraminifers from the early Permian to the Late Triassic: implications for the Guadalupian–Lopingian and the Permian–Triassic mass extinctions. Paleobiology 46: 511–532. Crossref
Frédérich, B. and Vandewalle, P. 2011. Bipartite life cycle of coral reef fishes promotes increasing shape disparity of the head skeleton during ontogeny: an example from damselfishes (Pomacentridae). BMC Evolutionary Biology 11 (1): 82. Crossref
Gedik, İ. 1968. Conodonts from the Lower Carboniferous of the Carnic Alps [in Turkish]. Bulletin of the Mineral Research and Exploration 1968 (70): 229–258.
Ginot, S. and Goudemand, N. 2019. Conodont size, trophic level, and the evolution of platform elements. Paleobiology 45: 458–468. Crossref
Girard, C. 1994. Conodont biofacies and event stratigraphy across the D/C boundary in the stratotype area (Montagne Noire, France). Courier Forschungsinstitut Senckenberg 168: 299–309.
Girard, C. and Renaud, S. 1996. Size variation in conodonts in response to the Upper Kellwasser crisis (Upper Devonian of the Montagne Noire France). Comptes Rendus de l’Academie des Sciences, Serie II. Sciences de la Terre et des Planetes 323: 435–442.
Girard, C. and Renaud, S. 2008. Disentangling allometry and response to Kellwasser anoxic events in the Late Devonian conodont genus Ancyrodella. Lethaia 41: 383–394. Crossref
Girard, C. and Renaud, S. 2012. Disparity Changes in 370 Ma Devonian Fossils: The Signature of Ecological Dynamics? PloS One 7: e36230. Crossref
Girard, C., Charruault, A.-L., Dufour, A.-B., and Renaud, S. 2023. Conodont size in time and space: Beyond the temperature-size rule. Marine Micropaleontology 184: 102291. Crossref
Girard, C., Charruault, A.-L., Gluck, T., Corradini, C., and Renaud, S. 2022. Deciphering the morphological variation and its ontogenetic dynamics in the Late Devonian conodont Icriodus alternatus. Fossil Record 25: 25–41. Crossref
Girard, C., Renaud, S., and Sérayet, A. 2004. Morphological variation of Palmatolepis Devonian conodonts: species versus genus. Comptes Rendus Palevol 3 (1): 1–8. Crossref
Guenser, P., Souquet, L., Dolédec, S., Mazza, M., Rigo, M., and Goudemand, N. 2019. Deciphering the roles of environment and development in the evolution of a Late Triassic assemblage of conodont elements. Paleobiology 45: 1–18. Crossref
Harmon, L.J., Kolbe, J.J., Cheverud, J.M., and Losos, J.B. 2005. Convergence and the multidimensional niche. Evolution 59: 409–421. Crossref
Hayden, L., Lochovska, K., Sémon, M., Renaud, S., Delignette-Muller, M.-L., Vilcot, M., Peterkova, R., Hovorakova, M., and Pantalacci, S. 2020. Developmental variability channels mouse molar evolution. ELife 9: e50103. Crossref
Hunt, G. 2007. Evolutionary divergence in directions of high phenotypic variance in the Ostracode genus Poseidonamicus. Evolution 61: 1560–1576. Crossref
Hunt, G. and Roy, K. 2006. Climate change, body size evolution, and Cope’s Rule deep-sea ostracodes. Proceedings of the National Academy of Sciences of the United States of America 103: 1347–1352. Crossref
Jeppsson, L. 1979. Conodont element function. Lethaia 12: 153–170. Crossref
Ji, Q. 1989. The Dapoushang Section: an Excellent Section for the Devonian–Carboniferous Boundary Stratotype in China. 265 pp. Science Press, Beijing.
Kaiser, S.I., Aretz, M., and Becker, R.T. 2016. The global Hangenberg Crisis (Devonian–Carboniferous transition): review of a first-order mass extinction. In: R.T. Becker, P. Königshof, and C.E. Brett (eds.), Devonian Climate, Sea Level and Evolutionary Events, Vol. 423, 387–437. Geological Society of London, London. Crossref
Kelz, V., Guenser, P., Rigo, M., and Jarochowska, E. 2023. Growth allometry and dental topography in Upper Triassic conodonts support trophic differentiation and molar-like element function. Paleobiology 49: 665–683. Crossref
Kingsolver, J.G. and Pfennig, D.W. 2004. Individual-level selection as a cause of Cope’s rule of phyletic size increase. Evolution; International Journal of Organic Evolution 58: 1608–1612. Crossref
Klapper, G. and Vodrážková, S. 2013. Ontogenetic and intraspecific variation in the late Emsian–Eifelian (Devonian) conodonts Polygnathus serotinus and P. bultyncki in the Prague Basin (Czech Republic) and Nevada (western U.S.). Acta Geologica Polonica 63: 153–174. Crossref
Kovarovic, K., Aiello, L.C., Cardini, A., and Lockwood, C.A. 2011. Discriminant function analyses in archaeology: are classification rates too good to be true? Journal of Archaeological Science 38: 3006–3018. Crossref
Luczkovich, J.J., Norton, S.R., and Gilmore, R.G. 1995. The influence of oral anatomy on prey selection during the ontogeny of two percoid fishes, Lagodon rhomboides and Centropomus undecimalis. Environmental Biology of Fishes 44: 79–95. Crossref
Martinez-Perez, C., Rayfield, E., Botella, H., and Donoghue, P. 2016. Translating taxonomy into the evolution of conodont feeding ecology. Geology 44: 247–250. Crossref
Mawson, R. 1998. Thoughts on late Pragian–Emsian polygnathid evolution: Documentation and discussion. Palaeontologia Polonica 58: 201–211.
Mitteroecker, P. and Bookstein, F. 2011. Linear discrimination, ordination, and the visualization of selection gradients in modern morphometrics. Evolutionary Biology 38: 100–114. Crossref
Nesme, F., Girard, C., Corradini, C., and Renaud, S. 2025. 3D models related to the publication: Convergent allometric trajectories in Devonian– Carboniferous unornamented Polygnathus conodonts. MorphoMuseuM [available online, https://doi:10.18563/journal.m3.254]. Crossref
Palmer, A.R. 2004. Symmetry breaking and the evolution of development. Science 306: 828–833. Crossref
Plotitsyn, A.N. and Zhuravlev, A.V. 2023. Model of phylomorphogeny of P1 elements of the Tournaisian (Mississippian) siphonodellids. Marine Micropaleontology 184: 102294. Crossref
Polly, P.D. 2015. Gene networks, occlusal clocks, and functional patches: new understanding of pattern and process in the evolution of the dentition. Odontology 103: 117–125. Crossref
Porto, A., Rolfe, S., and Maga, A.M. 2021. ALPACA: A fast and accurate computer vision approach for automated landmarking of three-dimensional biological structures. Methods in Ecology and Evolution 12: 2129–2144. Crossref
Purnell, M.A. 1994. Skeletal ontogeny and feeding mechanisms in conodonts. Lethaia 27: 129–138. Crossref
Purnell, M.A. and Donoghue, P.C.J. 1997. Architecture and functional morphology of the skeletal apparatus of ozarkodinid conodonts. Philosophical Transactions of the Royal Society B: Biological Sciences 352: 1545–1564. Crossref
Purnell, M., Donoghue, P.C.J., and Aldridge, R.J. 2000. Orientation and anatomical notation in conodonts. Journal of Paleontology 74: 113–122. Crossref
R Core Team 2020. R: A Language and Environment for Statistical Computing. R Foundation for Statistical Computing. Vienna [available online, https://www.r-project.org/]
Renaud, S. and Auffray, J.-C. 2013. The direction of main phenotypic variance as a channel to evolution: cases in murine rodents. Hystrix, the Italian Journal of Mammalogy 24: 85–93.
Renaud, S. and Girard, C. 1999. Strategies of survival during extreme environmental perturbations: evolution of conodonts in response to the Kellwasser crisis (Upper Devonian). Palaeogeography Palaeoclimatology Palaeoecology 146: 19–32. Crossref
Renaud, S., Ecalle, B., Claisse, P., Charruault, A.-L., Ledevin, R., and Girard, C. 2021b. Patterns of bilateral asymmetry and allometry in Late Devonian Polygnathus conodonts. Palaeontology 64: 137–159. Crossref
Renaud, S., Girard, C., and Dufour, A.-B. 2021a. Morphometric variance, evolutionary constraints and their change through time in Late Devonian Palmatolepis conodonts. Evolution 75: 2911–2929. Crossref
Rohlf, F.J. and Slice, D. 1990. Extensions of the procrustes method for the optimal superimposition of landmarks. Systematic Zoology 39: 40–59. Crossref
Sallan, L. and Galimberti, A.K. 2015. Body-size reduction in vertebrates following the end-Devonian mass extinction. Science 350: 812–815. Crossref
Schlager, S. 2017. Chapter 9: Morpho and Rvcg—shape analysis in R: R-packages for geometric morphometrics, shape analysis and surface manipulations. In: G. Zheng, S. Li, and G. Székely (eds.), Statistical Shape and Deformation Analysis, 217–256. Elsevier, Amsterdam. Crossref
Schluter, D. 1996. Adaptive radiation along genetic lines of least resistance. Evolution 50: 1766–1774. Crossref
Shirley, B., Grohganz, M., Bestmann, M., and Jarochowska, E. 2018. Wear, tear and systematic repair: testing models of growth dynamics in conodonts with high-resolution imaging. Proceedings of the Royal Society B: Biological Sciences 285 (1886): 20181614. Crossref
Smits, P.D. and Evans, A.R. 2012. Functional constraints on tooth morphology in carnivorous mammals. BMC Evolutionary Biology 12: 146. Crossref
Song, H., Tong, J., and Chen, Z.Q. 2011. Evolutionary dynamics of the Permian–Triassic foraminifer size: Evidence for Lilliput effect in the end-Permian mass extinction and its aftermath. Palaeogeography, Palaeoclimatology, Palaeoecology 308: 98–110. Crossref
Souquet, L., Guenser, P., Girard, C., Mazza, M., Rigo, M., and Goudemand, N. 2022. Temperature-driven heterochrony as a main evolutionary response to climate changes in conodonts. Proceedings of the Royal Society B: Biological Sciences 289 (1985): 20220614. Crossref
Sweet, W.C. 1988. The Conodonta. Morphology, taxonomy, paleoecology, and evolutionary history of a long-extinct animal phylum. Oxford Monographs on Geology and Geophysics 10: 1–224.
Świś, P. 2023. Anagenetic evolution and peramorphosis of a latest Devonian conodont from Holy Cross Mountain (Poland). Journal of Micropalaeontology 42: 193–210. Crossref
Twitchett, R.J. 2007. The Lilliput effect in the aftermath of the end-Permian extinction event. Palaeogeography, Palaeoclimatology, Palaeoecology 252: 132–144. Crossref
Urbanek, A. 1993. Biotic crises in the history of Upper Silurian graptoloids: A Palaeobiological model. Historical Biology 7: 29–50. Crossref
Viscosi, V. and Cardini, A. 2011. Leaf morphology, taxonomy and geometric morphometrics: a simplified protocol for beginners. PLoS ONE 6 (10): e25630. Crossref
Vorontsova, T.N. 1996. The genus Neopolygnathus (Conodonta): Phylogeny and some questions of systematics. Paleontologičeskij žurnal 1996 (2): 82–84.
Walliser, O. (ed.) 1996. Global Events and Event Stratigraphy in the Phanerozoic: Results of the International Interdisciplinary Cooperation in the IGCP-Project 216 “Global Biological Events in Earth History”. 333 pp. Springer, Berlin. Crossref
Ward-Campbell, B.M.S., Beamish, F.W.H., and Kongchaiya, C. 2005. Morphological characteristics in relation to diet in five coexisting Thai fish species. Journal of Fish Biology 67: 1266–1279. Crossref
Wiest, L.A., Buynevich, I.V., Grandstaff, D.E., Terry, D.O., and Maza, Z.A. 2015. Trace fossil evidence suggests widespread dwarfism in response to the end-Cretaceous mass extinction: Braggs, Alabama and Brazos River, Texas. Palaeogeography, Palaeoclimatology, Palaeoecology 417: 105–111. Crossref
Yolkin, E.A., Weddige, K., Izokh, N.G., and Erina, M.V. 1994. New Emsian conodont zonation (Lower Devonian). Courier Forschungsinstitut Senckenberg 168: 139–157.
Zhuravlev, A.Y. and Wood, R. 2020. Dynamic and synchronous changes in metazoan body size during the Cambrian Explosion. Scientific Reports 10 (1): 6784. Crossref
Acta Palaeontol. Pol. 70 (1): 25–41, 2025
https://doi.org/10.4202/app.01198.2024